What does my model rely on?
The first question after training a model is the same every time: which concepts does the model lean on, and which ones is it ignoring? This page covers the three metrics and three plots that answer it, plus the bootstrap that tells you whether the ranking is actually trustworthy on your sample size.
When to use this
- After every retraining, to sanity-check that the model's importance story matches the team's mental model.
- Before any cohort / fairness / drift analysis — those questions only make sense for concepts the model actually uses.
- When writing the model report's "what does the model depend on" section.
The three building blocks
| Function | Returns | Use for |
|---|---|---|
feature_counts |
Per-node feature count (model-free) | Sizing the structural backbone. |
utilization |
Per-concept is_used flag + importance |
Greying out the parts of the tree the model ignores. |
importance_sum |
Per-concept summed mean|SHAP| | Ranking the concepts the model uses. |
All three return a pandas.DataFrame indexed by the concept's
/-joined path. They join trivially on path for composite views.
Minimal example
from concept_graph_xai import (
bootstrap_importance, bootstrap_importance_bar,
importance_sum, sunburst, utilization, utilization_map,
)
# 1. Which parts does the model actually use?
util = utilization(graph, feature_names, shap_values, threshold=0.0)
utilization_map(graph, util).show()
# 2. Of the used parts, how much does each one carry?
imp = importance_sum(graph, feature_names, shap_values)
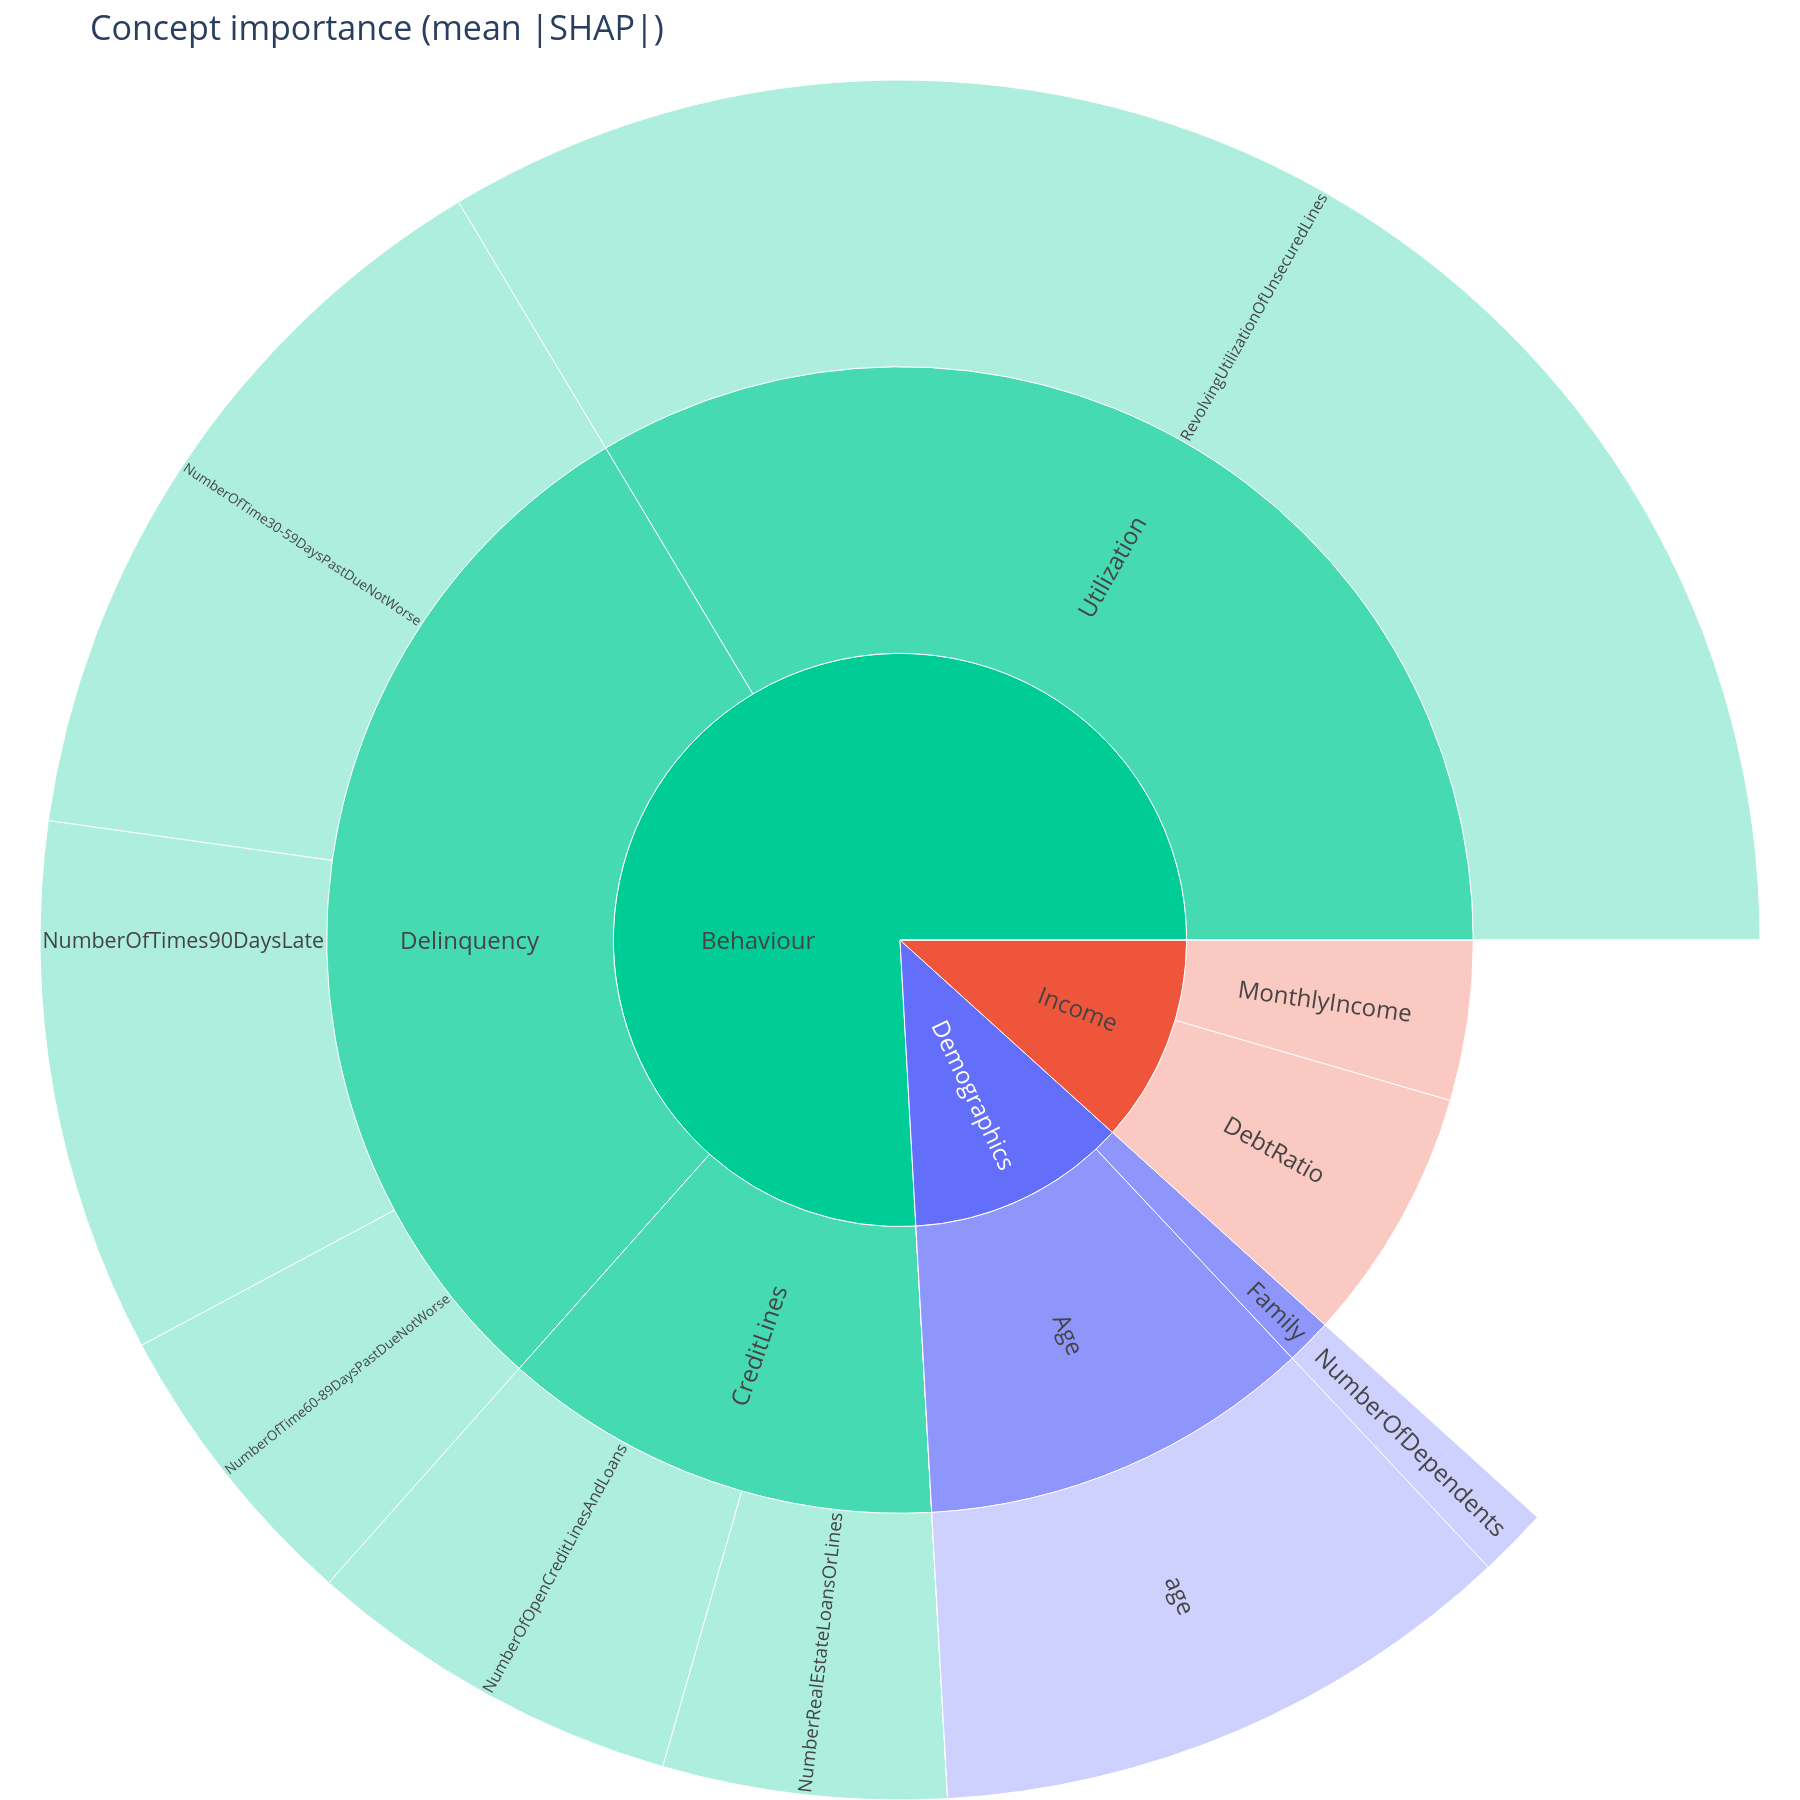
sunburst(graph, imp, value="importance_sum").show()
# 3. Is that ranking statistically separable on this sample size?
boot = bootstrap_importance(graph, feature_names, shap_values,
n_boot=1000, ci=0.95, random_state=42)
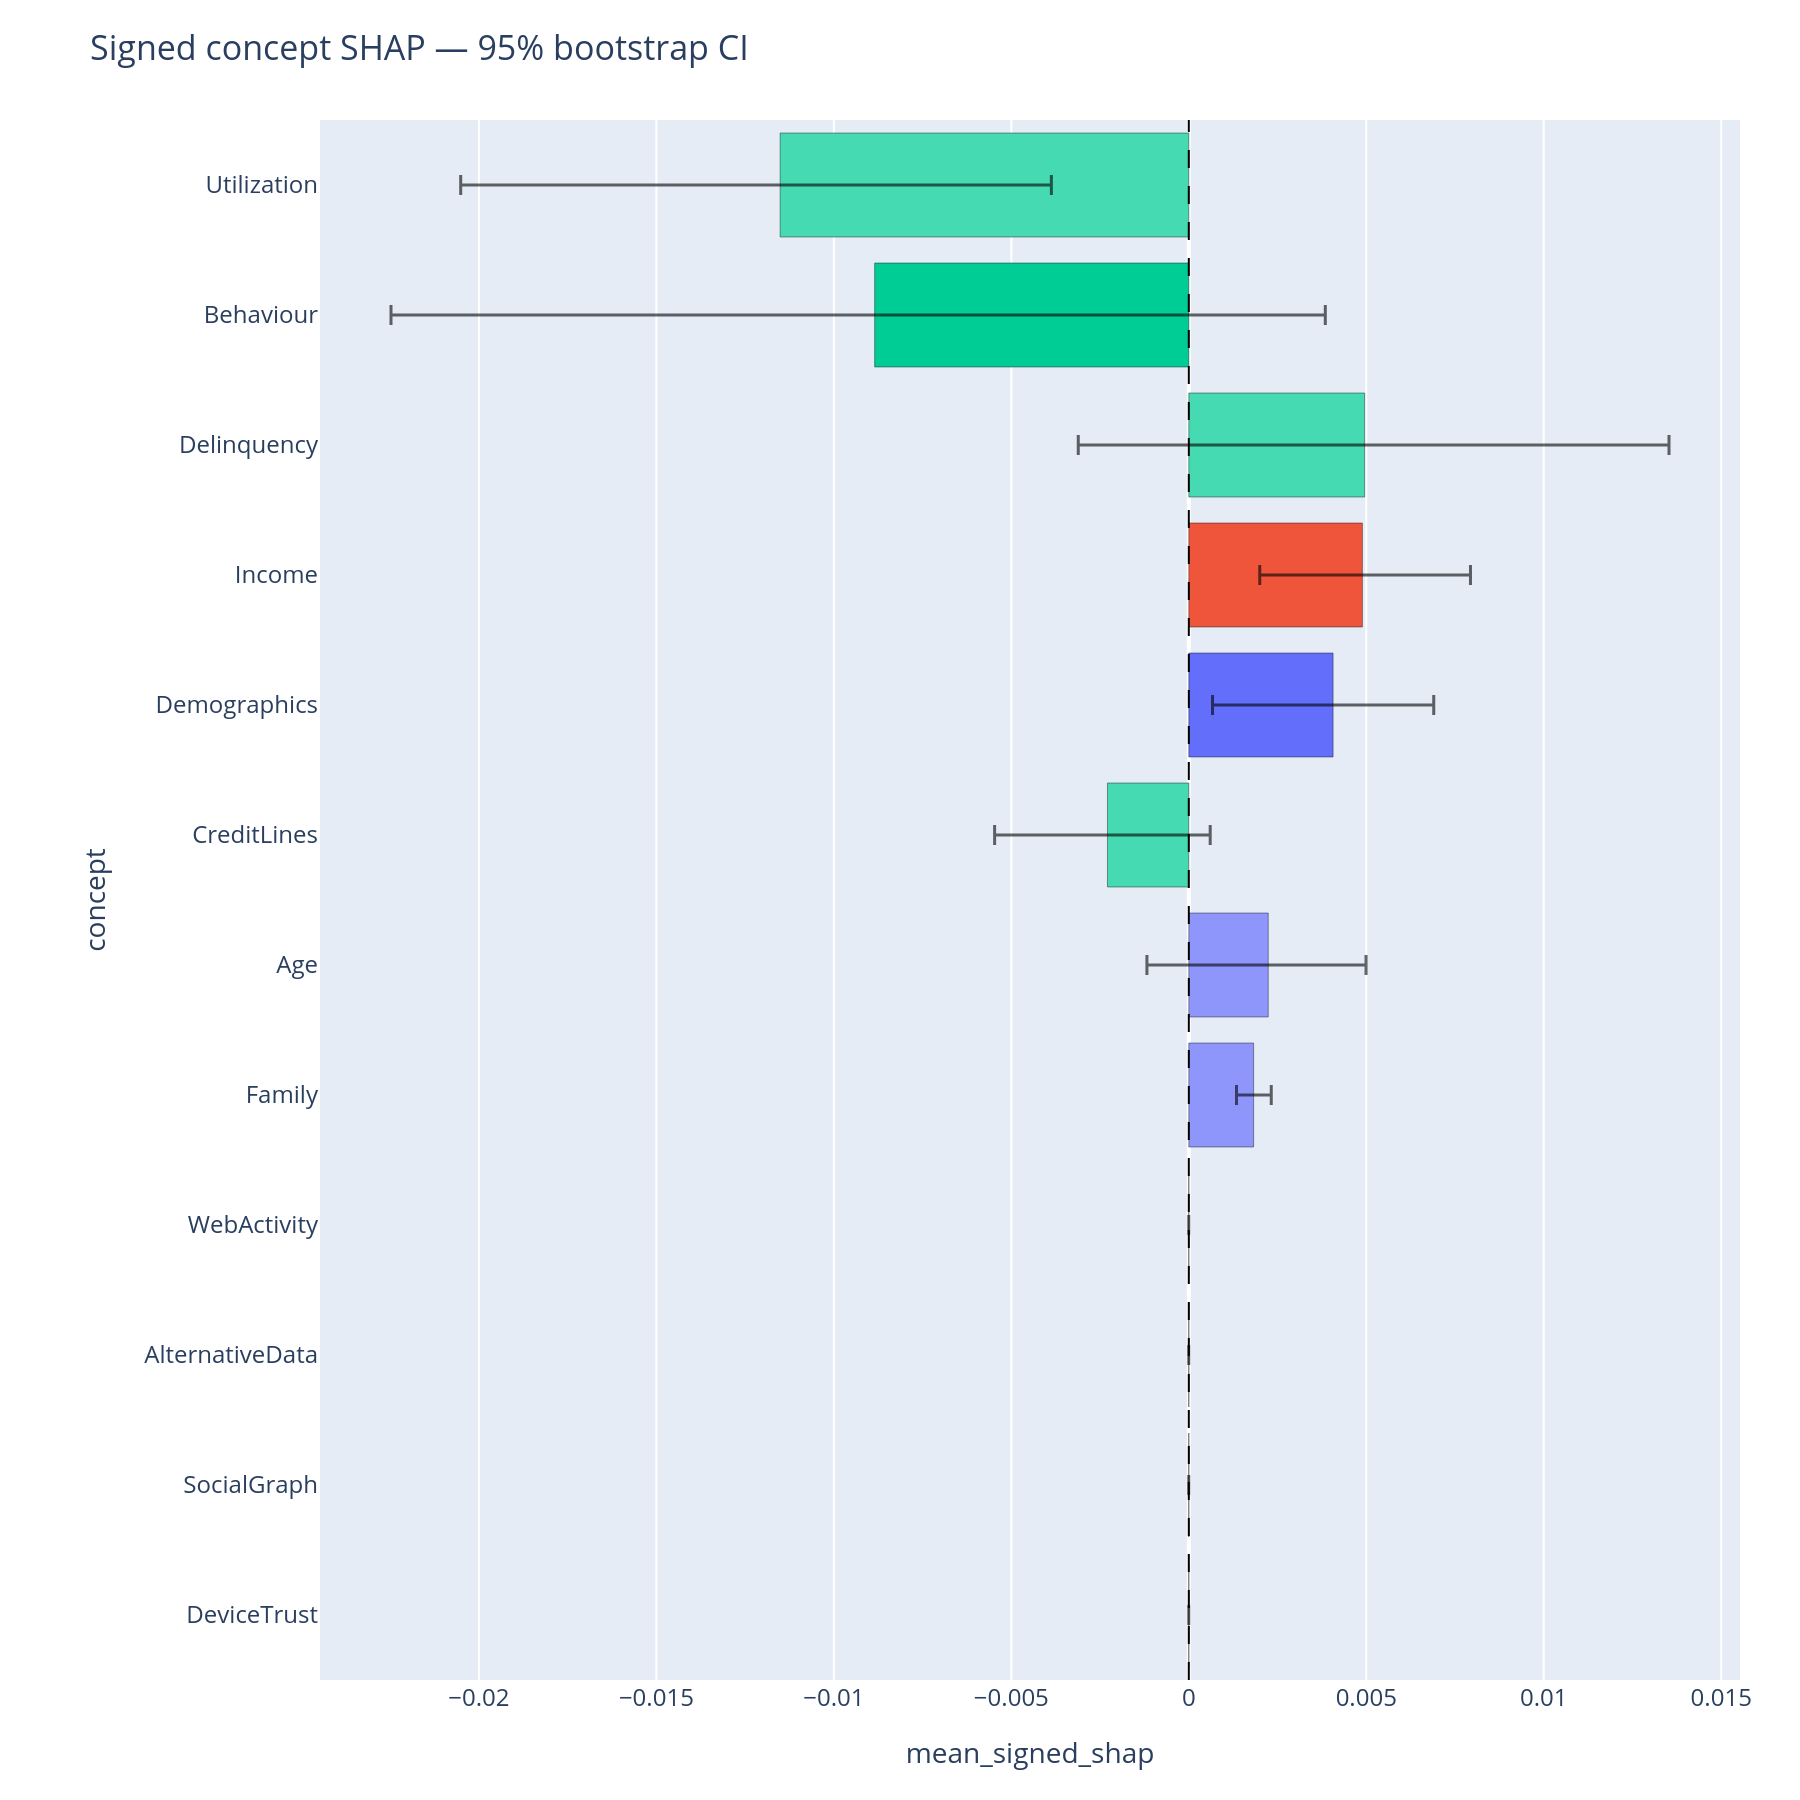
bootstrap_importance_bar(boot).show()

Reading the output
Utilization map
Saturated sectors are concepts whose descendant features hit at least
one |SHAP| value above threshold. Grey sectors are defined in
the tree but invisible at inference time. The root is hidden so the
top-level branches form the centre ring (the
sunburst_layout helper handles the re-parenting
when hide_root=True, the default).
Common causes of an unexpectedly grey sector:
- The underlying feature is constant in this data slice.
- The model assigned negligible weight (tree-based importance has long
tails — raising
thresholdto e.g.0.01makes "barely used" visible as grey). - The feature name in the graph does not exactly match the column in
feature_names. Runalign_features(graph, feature_names, on_unknown="raise")to catch this.
Importance sunburst
Each sector's area is sum_{f in concept.descendants} mean_n(|SHAP[n,
f]|). Hover shows the exact value and the feature_count carried in
that subtree. Colour follows the top-level branch and is progressively
lightened with depth (see
branch_colors) so a Behaviour > Delinquency
leaf is a paler shade of the same hue as its parent.
Bootstrap bar
Horizontal bars are bootstrap percentile confidence intervals (default
n_boot=1000, ci=0.95). A bar that overlaps the next-ranked
concept's interval means the ranking is not statistically
separable at this sample size. Quote "comparable", not "ranked", in
the report.
What to do with the answer
- Promote concepts with tight, non-overlapping intervals to the executive summary.
- Flag overlapping intervals as "comparable" rather than ranked.
- Open a coverage ticket for any grey sector that should have been used (data-engineering question, not a model question).
- Carry the importance-ranked list into the next workflow steps (composition, cohort, fairness, robustness).
Common pitfalls
- Mismatched feature names. Default behaviour on unknown
feature names is
on_unknown="warn". Switch to"raise"while developing,"ignore"only when you understand the omissions. - Signed vs absolute.
importance_sumaggregatesmean(|SHAP|)by default. Passsigned=Trueif you want net direction (positive vs negative contribution) — keep in mind that signed values can cancel inside a concept, making it look unimportant when it is in fact strongly bidirectional. - Bootstrap cost.
n_boot=1000is the default. For10k rows × 200 features, 1000 resamples can run for minutes — start at
n_boot=200during exploration and bump up before the final report.
Related
feature_counts,importance_sum,utilization,bootstrap_importance— API reference.- Composition — once you know which concepts matter, how do they combine?
- Cohort — does this ranking change across segments?
- Tour, Part B — the same answers in narrative form.