What if data goes missing or my model has drifted?
Two failure modes that are not visible at training time but matter the moment the model is in production: a whole concept's data going missing (vendor outage, upstream feed cutoff, geography change), and the concept-level contributions shifting across periods even when overall metrics look stable.
When to use this
- Before promoting a model to production, to write the operational-risk row "what if concept X goes missing?".
- After a vendor outage or feed change, to quantify what the model actually lost.
- Quarterly (or whenever the model is rescored on fresh data), to monitor concept-level drift before the global AUC tells you something is wrong.
The two views
| Function | Returns | Use for |
|---|---|---|
auc_drop + auc_drop_map |
Per-concept AUC drop (or any metric drop) under ablation | "What does the model lose if concept X disappears?" |
attribution_drift + concept_drift_lines + concept_drift_sunburst |
Per-(period, concept) mean|SHAP|; line + delta-sunburst views | "Across periods, where is the concept-level drift?" |
Ablation: three strategies
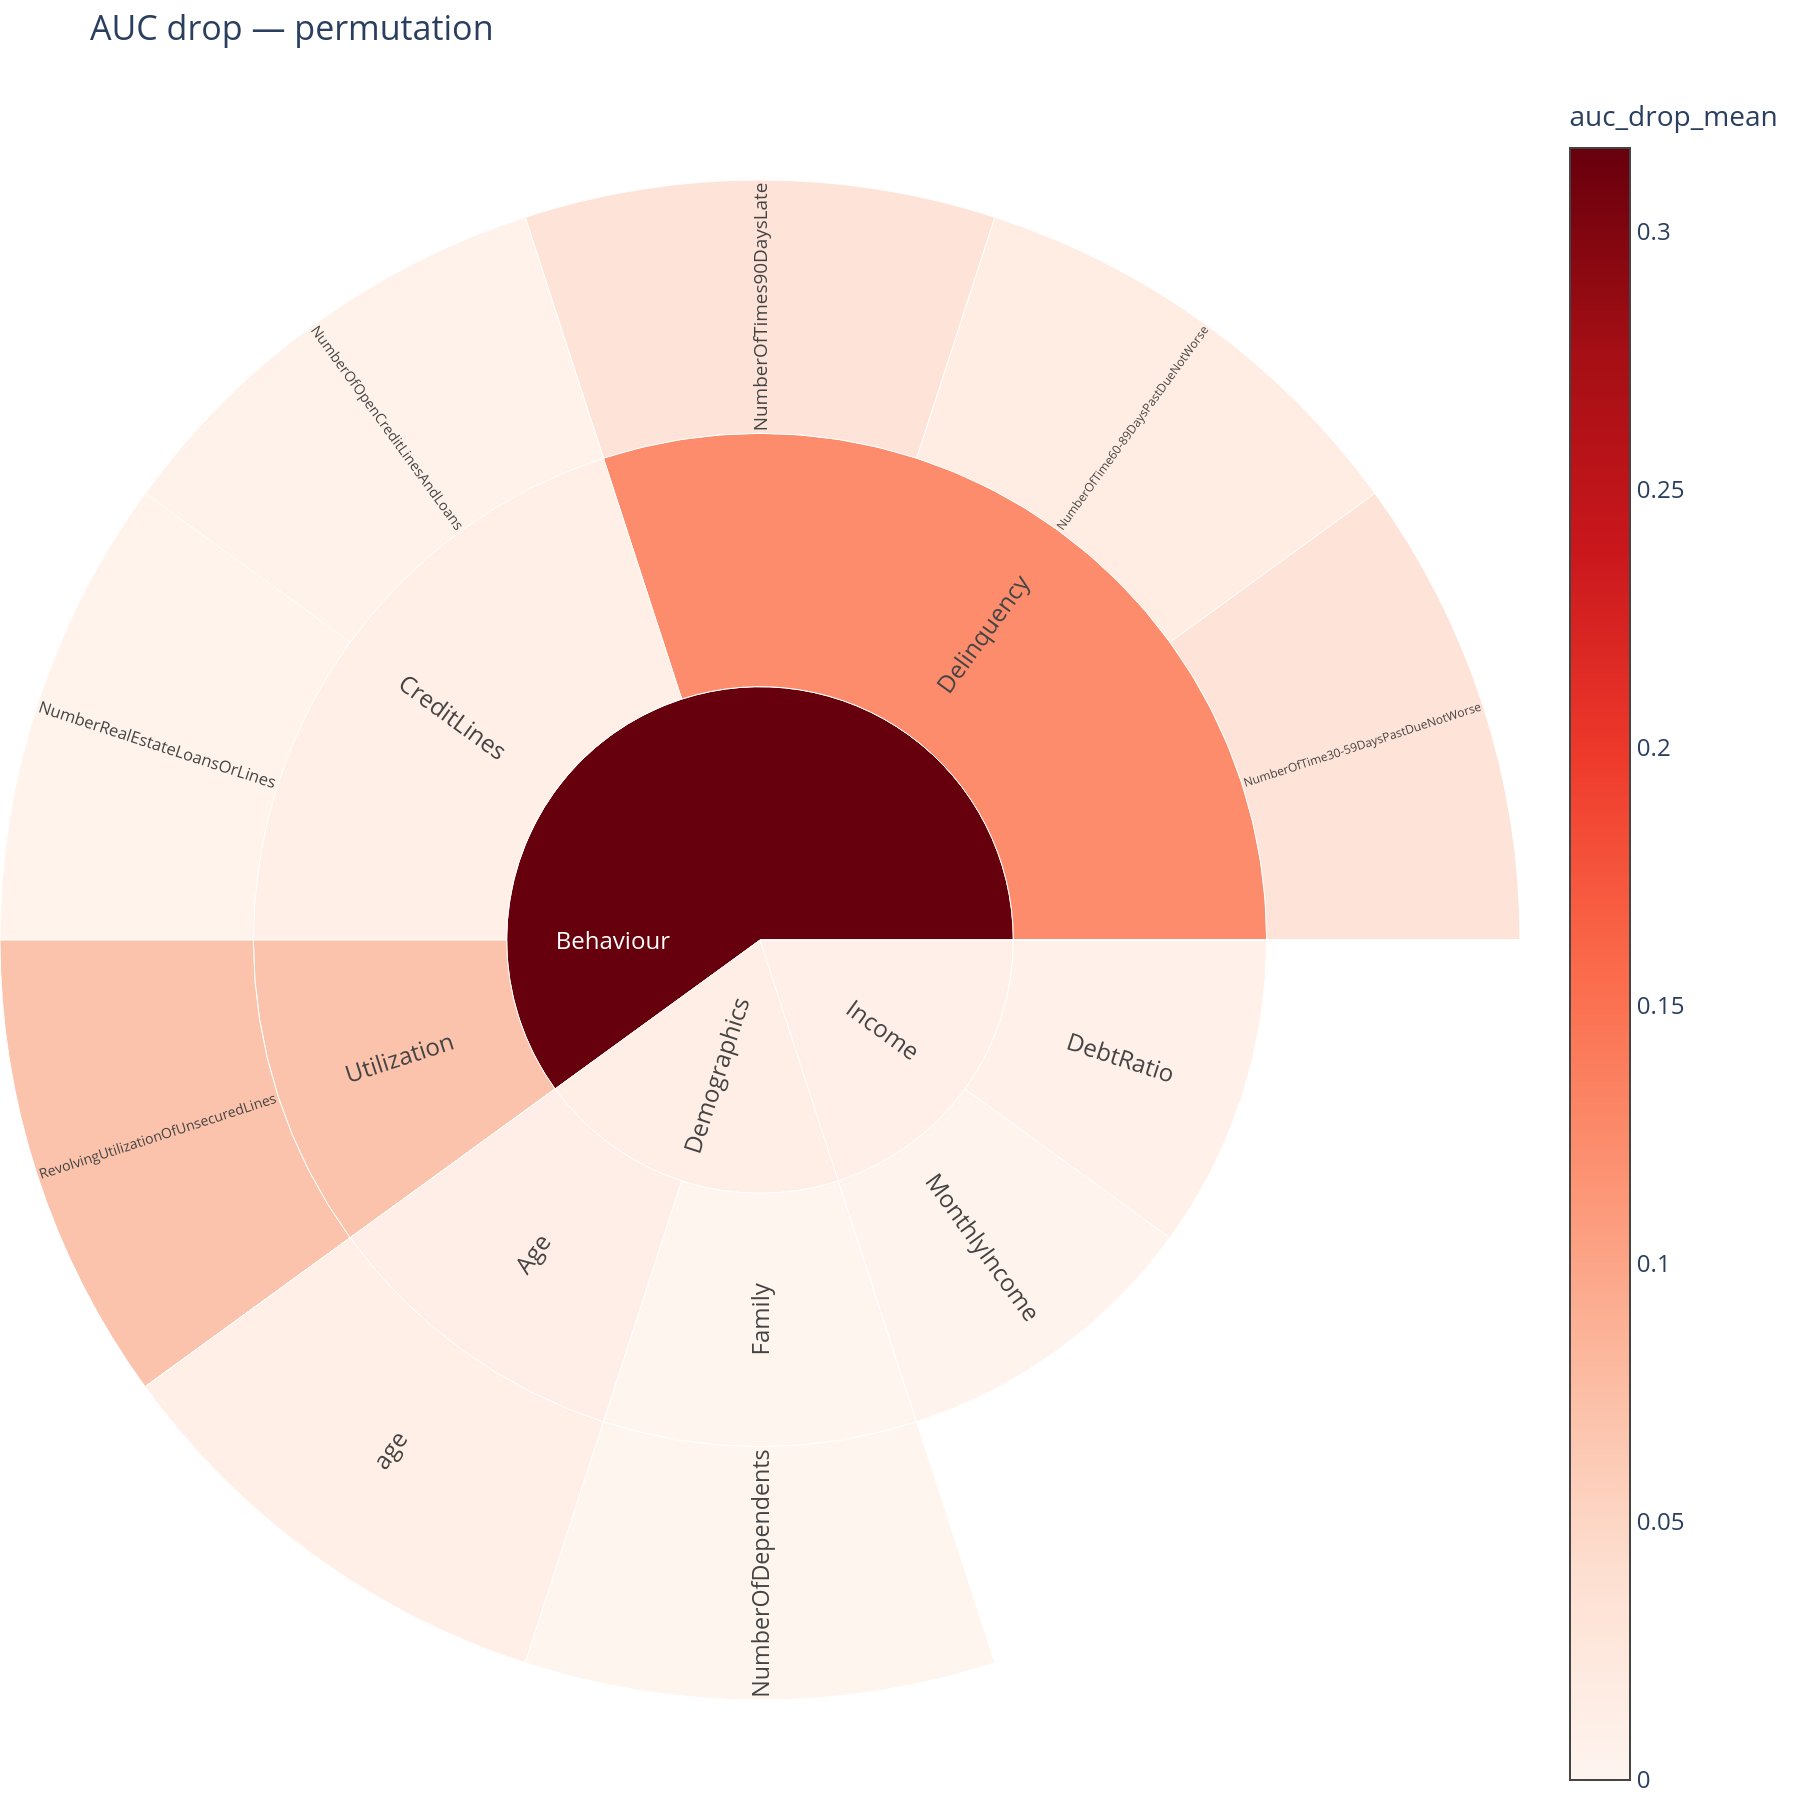
auc_drop answers "how much performance do I lose if a whole
concept's data goes missing?" with three different definitions of
"missing", trading off accuracy for cost.
permutation (default)
For each concept, shuffle the values of its features across rows
and re-score on the held-out set, repeated n_repeats times.
- Cheap — no retraining.
- Model-agnostic — works for any model with
predict_proba/decision_function. - The model still expects the features to be there; it just sees decorrelated values. This is an upper bound on "what would happen if the data became uninformative", not "what would happen if the column was deleted".
auc_drop(graph, model, X_test, y_test,
         feature_names=X_test.columns.tolist(),
         strategy="permutation",
         n_repeats=10, random_state=42)
Output columns: auc_drop_mean, auc_drop_std (across repeats),
ablated_score_mean, baseline_score, feature_count, strategy.
retrain
For each concept, drop its features from the training set, retrain, score on the held-out set with the same columns dropped.
- Most faithful to "this column will not exist in production".
- Most expensive: one retrain per concept.
- Requires a user-supplied
train_fn(X_train, y_train) ->
  fitted_estimator
callable so the package can rebuild the model exactly the way you want.
def train_lgb(X, y):
    m = lgb.LGBMClassifier(n_estimators=200, random_state=42, verbose=-1)
    m.fit(X, y)
    return m

auc_drop(graph, model, X_test, y_test,
         feature_names=X_test.columns.tolist(),
         strategy="retrain",
         train_fn=train_lgb,
         X_train=X_train, y_train=y_train)
auc_drop_std is NaN (single retrain, no spread across repeats).
shap_marginal
Cheapest. Subtract the concept's SHAP contributions from the prediction logits, apply the link function, re-score.
- Almost free once you have SHAP values.
- An approximation under SHAP additivity. Treats each concept's contribution as independently subtractable, which is exact only for additive models.
- Useful as a sanity check or for fast iteration; not for regulatory submissions.
auc_drop(graph, model, X_test, y_test,
         feature_names=X_test.columns.tolist(),
         strategy="shap_marginal",
         shap_values=shap_values,
         base_predictions=p_test)
Picking a strategy
| Use case | Strategy |
|---|---|
| Quick iteration, "is this branch important?" | permutation |
| Sanity check, you already have SHAP values | shap_marginal |
| Regulatory submission, "what happens if Equifax goes down?" | retrain |
| Comparison study (run all three, look for disagreements) | All three with the same graph |
A common pattern: run permutation first to identify the top-k
concepts, then retrain only on those k.
Custom scoring metrics
auc_drop accepts any sklearn-compatible scoring callable via the
metric argument.
from sklearn.metrics import log_loss

auc_drop(..., metric="roc_auc")                  # built-in
auc_drop(..., metric=lambda y, p: -log_loss(y, p))  # any callable
The function name (auc_drop) is historical; the implementation is
metric-agnostic.
What skip_root does
The root concept covers every feature; ablating it means "the model gets pure noise / nothing", which by definition tanks the score.
skip_root=True (the default) leaves the root row in the DataFrame
with auc_drop_mean = NaN so it does not pollute the colour scale of
auc_drop_map. The structural columns
(feature_count, etc.) are still populated — required so the parent
sunburst sector is not smaller than its children.
Realism — does this scenario actually happen?
auc_drop tells you what would happen if a concept went missing.
To answer how often that actually happens, pair with
joint_missing_rate:
import pandas as pd

drop = auc_drop(graph, model, X_test, y_test,
                feature_names=X_test.columns.tolist(),
                strategy="permutation").reset_index()
jmr  = joint_missing_rate(graph, X_test).reset_index()

risk = (drop[["path", "auc_drop_mean"]]
        .merge(jmr[["path", "joint_missing_rate"]], on="path")
        .assign(realism_weighted=lambda d:
                d["auc_drop_mean"] * d["joint_missing_rate"]))
The package deliberately does not bake realism_weighted into
auc_drop (see decision D2 in the
roadmap decision log) — different teams want
different fusion rules, and the join is one line.
Drift across periods
attribution_drift aggregates SHAP per (period, concept) and returns
a long-form DataFrame the drift plots consume. Periods can be
anything categorical: calendar quarters, model versions, geographies,
a before/after-launch flag.
from concept_graph_xai import (
attribution_drift, concept_drift_lines, concept_drift_sunburst,
)
dr = attribution_drift(graph, feature_names, shap_values,
periods="period_label", X=X)
# Line chart — "did each concept's contribution stay stable?"
concept_drift_lines(dr, max_concepts=8).show()
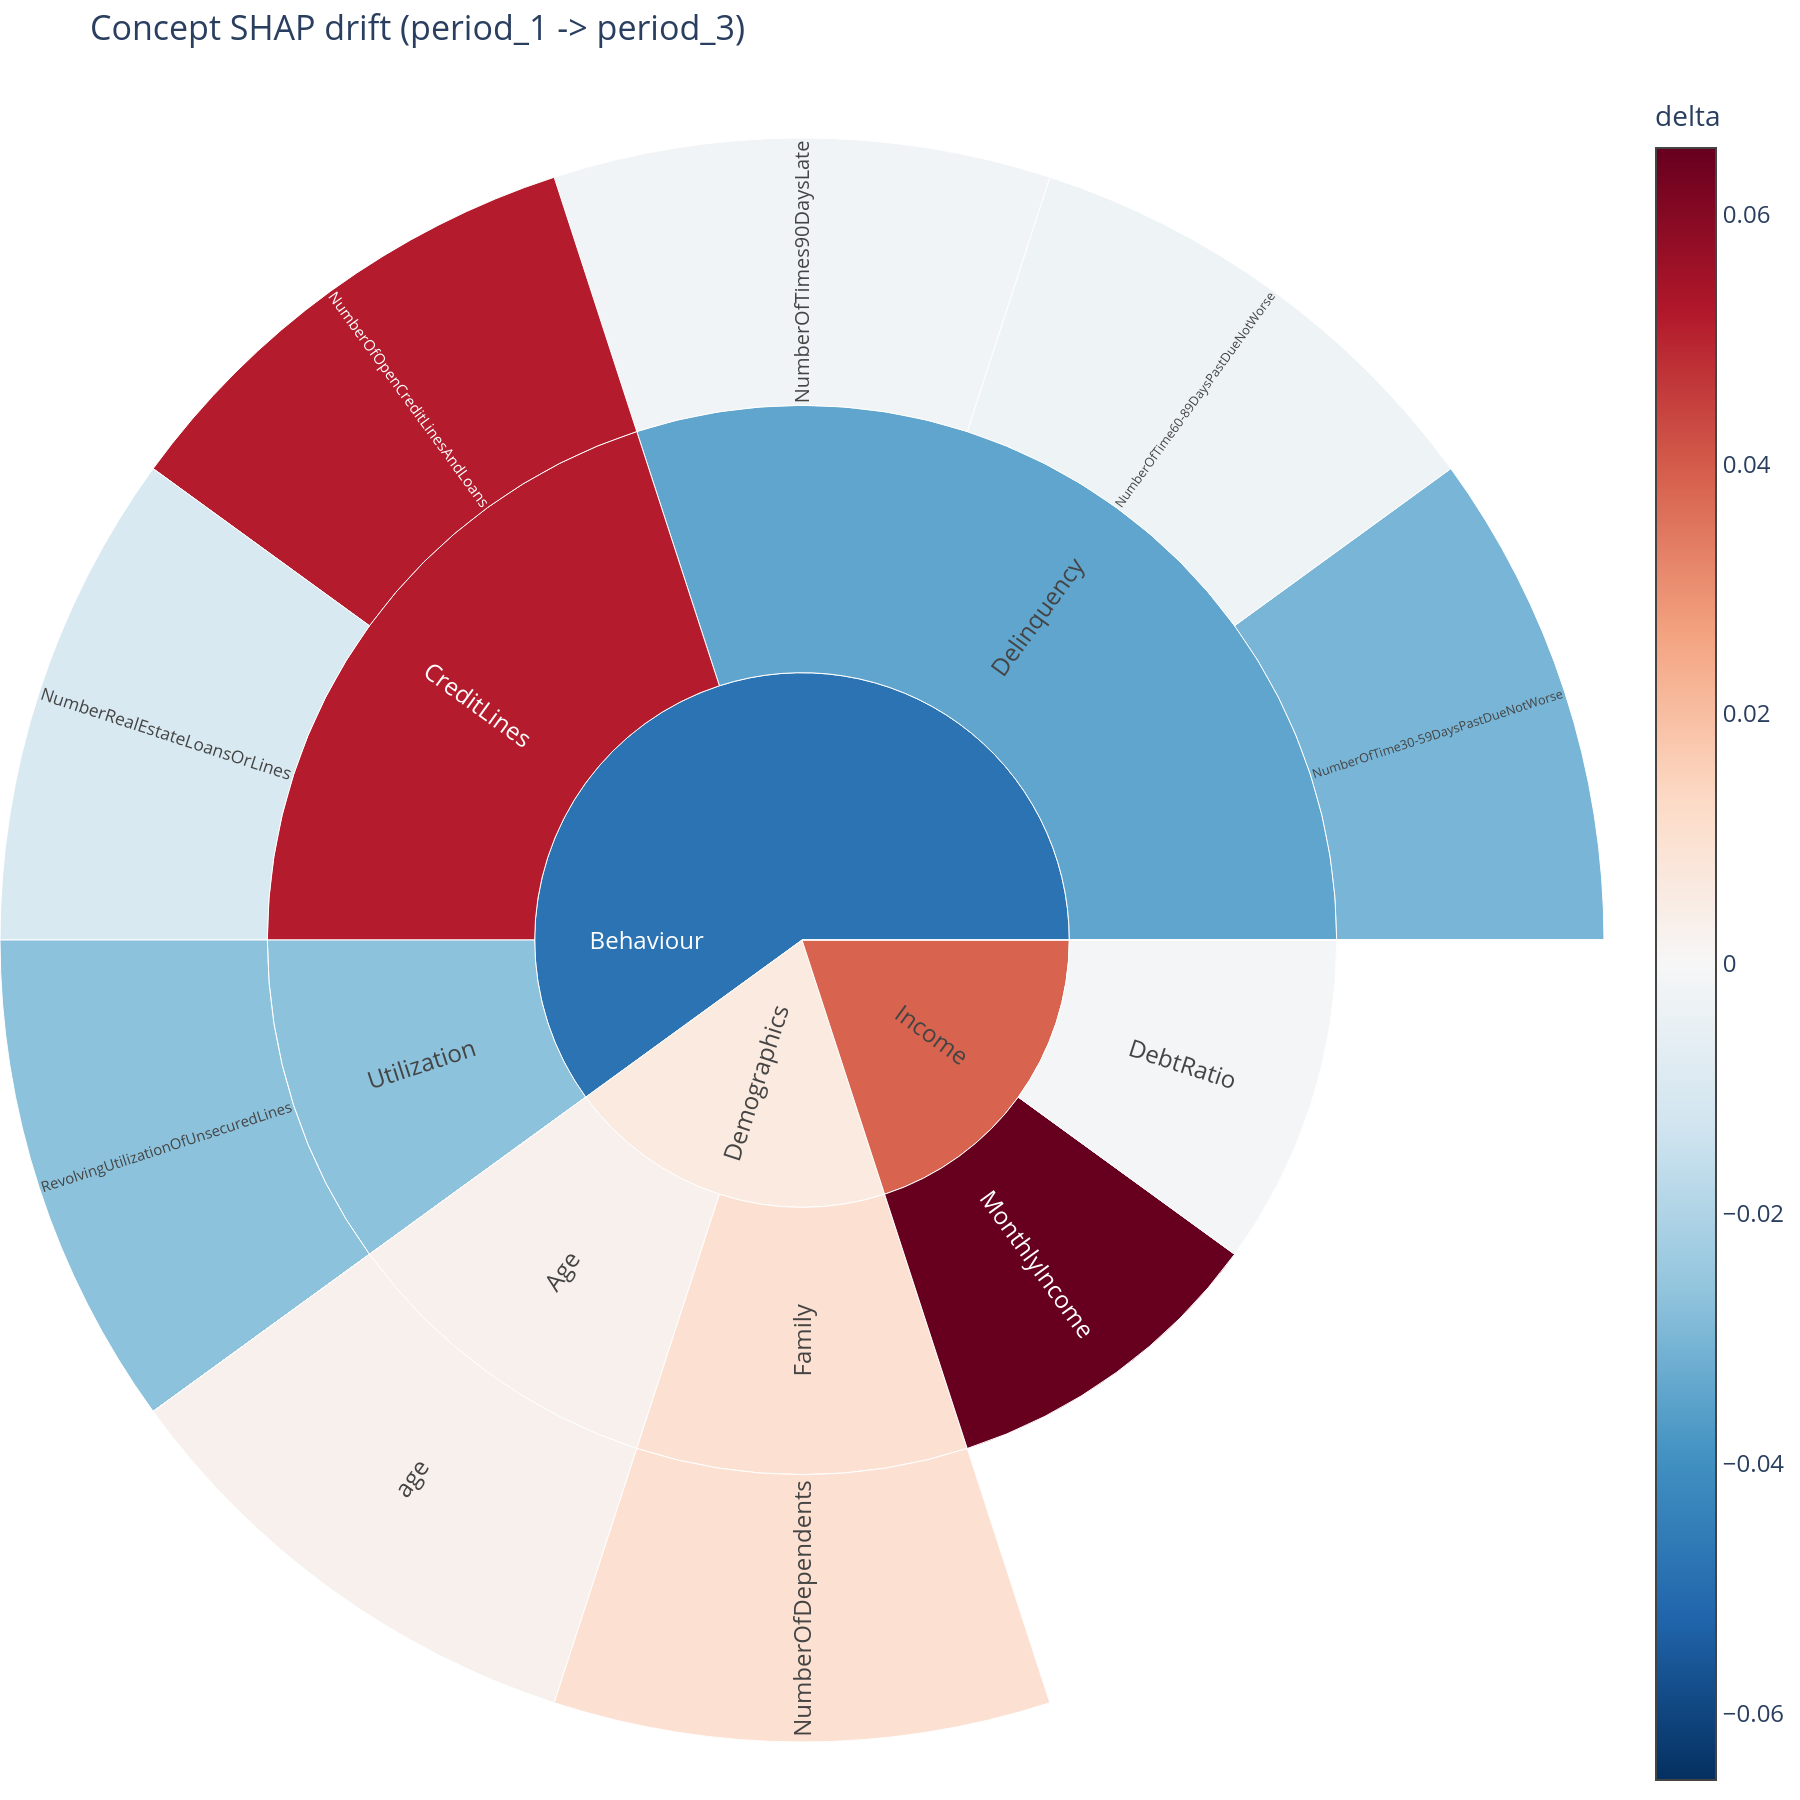
# Delta sunburst — "where in the tree is the drift concentrated?"
concept_drift_sunburst(graph, dr,
baseline="2024Q1", target="2024Q4").show()
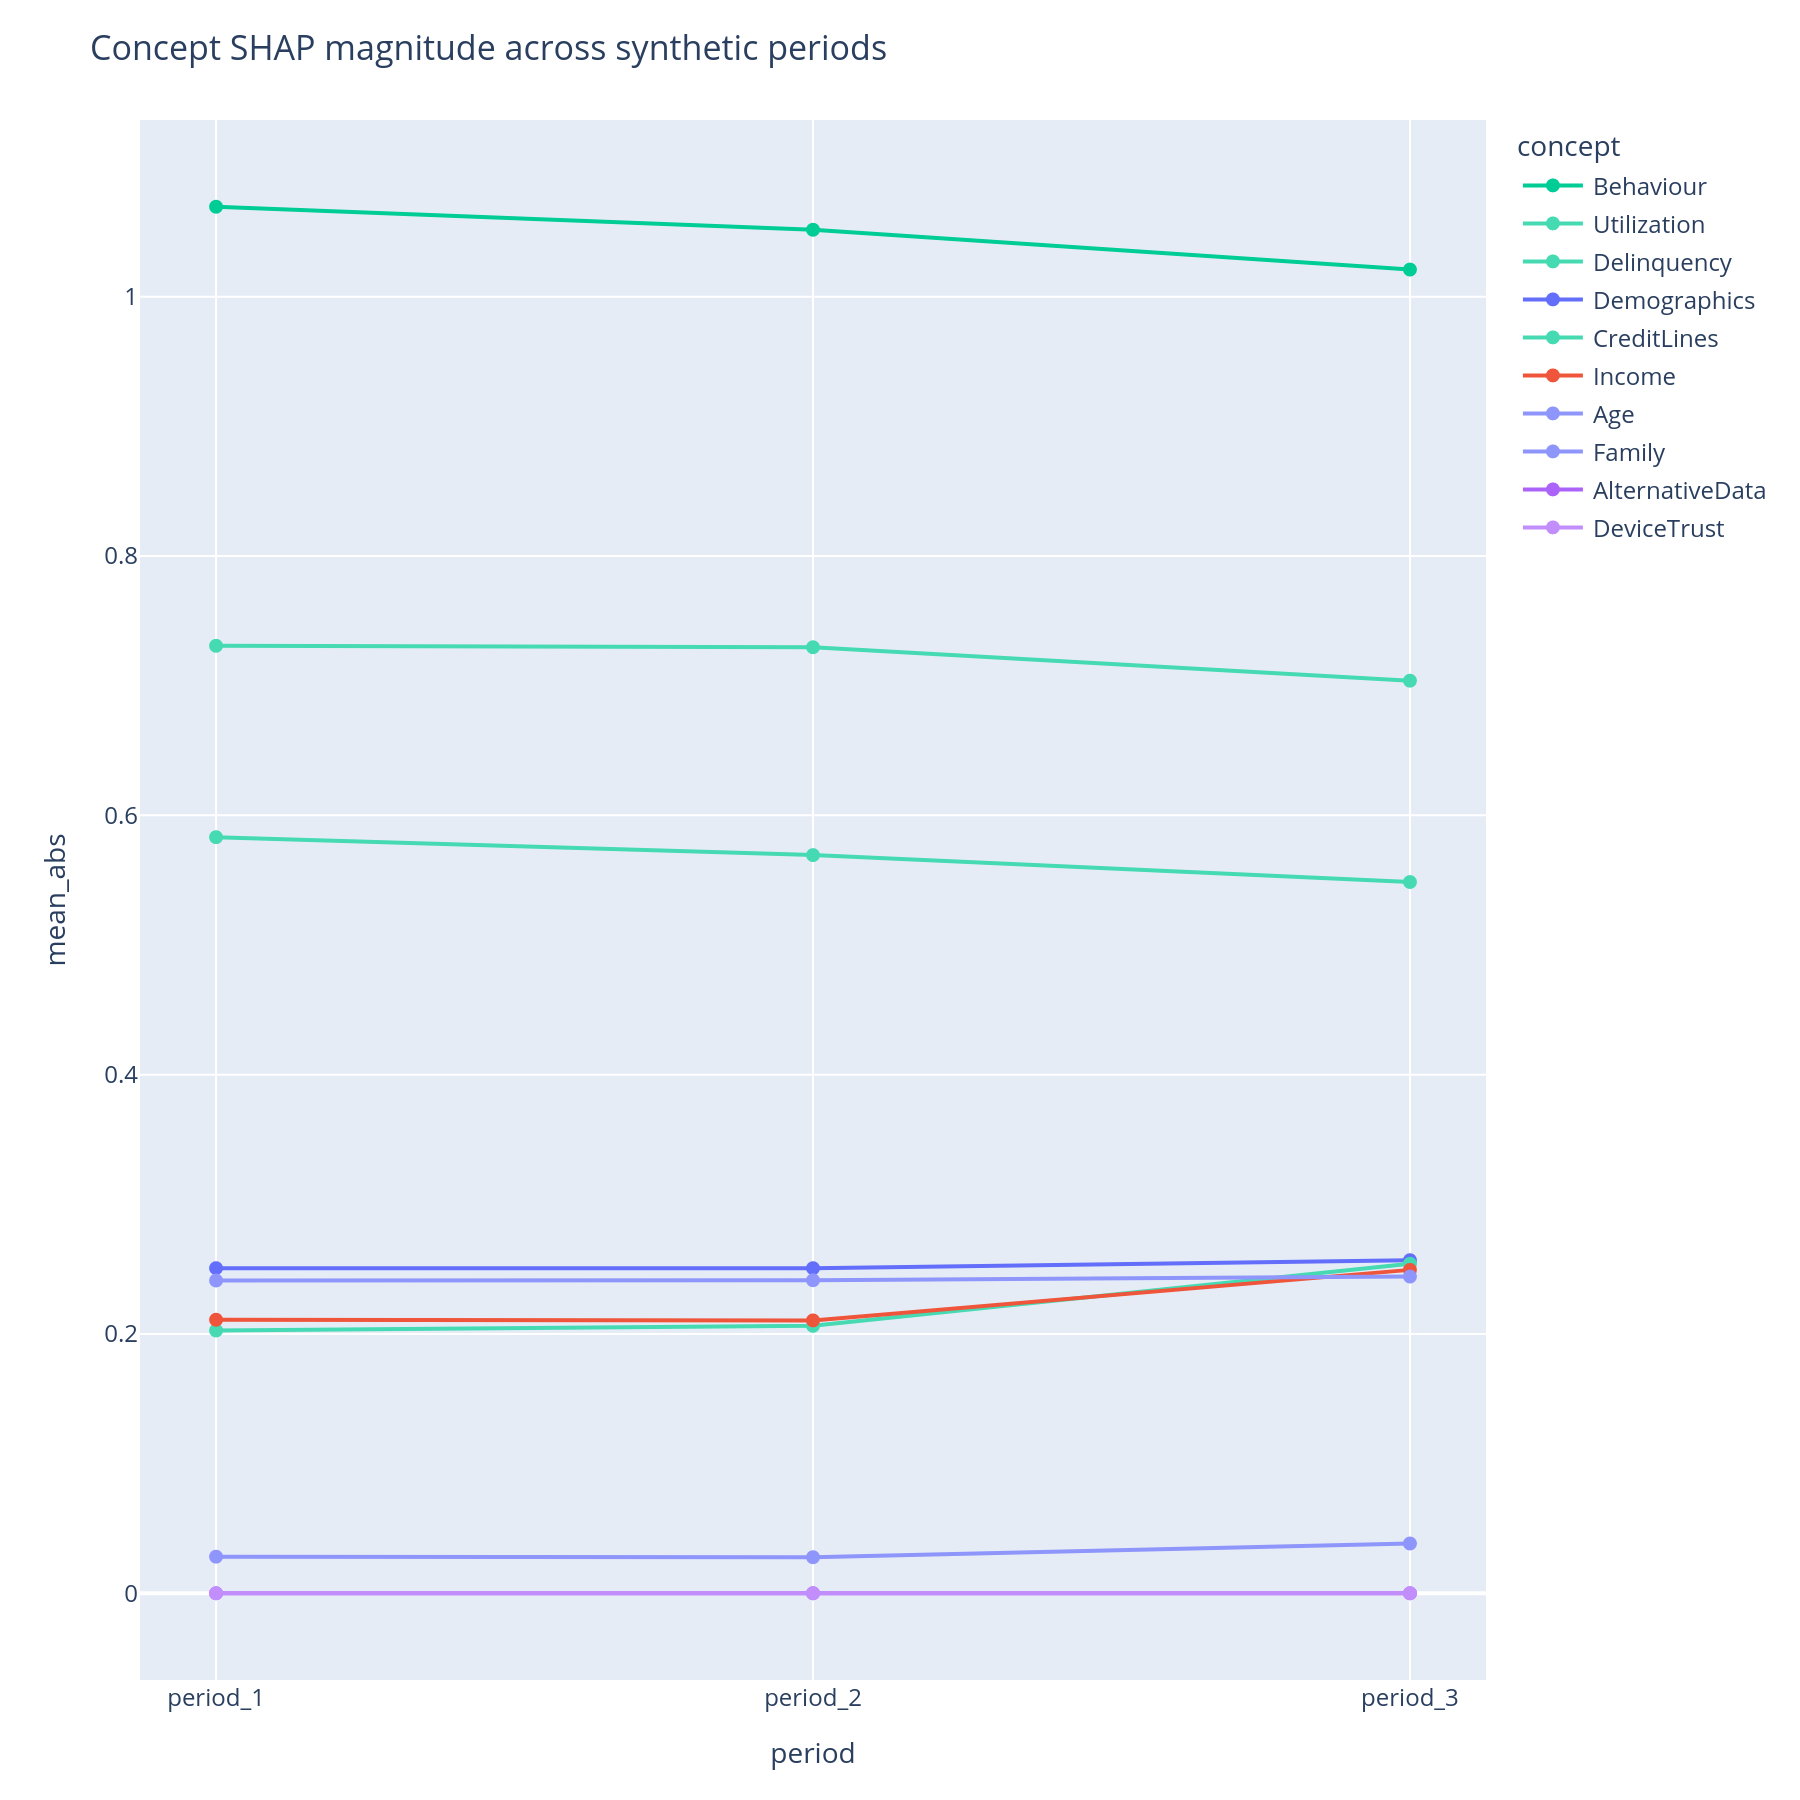
Reading the lines
One line per concept, x = period in stable order, y = mean|SHAP| for
that concept in that period. Lines are sorted by max-across-periods
so the most prominent concepts list first; max_concepts= caps the
chart at the top-K to avoid spaghetti.
Reading the delta sunburst
Sector area = the concept's total contribution. Colour = signed
change target - baseline (diverging palette). Red sectors got more
important; blue sectors got less. Pair with the line chart: the
sunburst answers where, the lines answer how monotonically.
What to do with the answer
- Define a retraining trigger in concept terms (e.g. "retrain if any top-3 concept's mean|SHAP| moves by more than X across two consecutive quarters"). This is what the drift sunburst is for.
- Cross-reference drift with the disparity heatmap from fairness: drift that lands in protected-group concepts is the most urgent kind.
- Quote ablation numbers weighted by joint-missing-rate when pushing them into operational-risk; the raw AUC drop is a "what-if", the realism-weighted version is an "expected loss".
Common pitfalls
- Permutation can show positive AUC drops on noise. If
auc_drop_meanis negative for some concept, the permutation improved the score — which usually means the feature was injecting noise the model latched onto. Worth investigating, not a bug. - Retrain identity. The retrain strategy will rebuild the model
exactly as
train_fndefines. If your training pipeline includes preprocessing (e.g. categorical encoders that learned categories from the training set), wrap that insidetrain_fnso the ablation actually reflects retraining-from-scratch. - Drift period order. Set
pd.CategoricalDtypewith explicit category order on theperiodscolumn for chronological ordering. First-seen ordering will mis-sort if the data is shuffled.
Related
auc_drop,attribution_drift,concept_drift_lines,concept_drift_sunburst,joint_missing_rate— API reference.- Concept-design — the joint-missing-rate sunburst that calibrates the realism of the AUC-drop scenario.
- Cohort and Fairness — drift across segments or protected groups is often the right level at which to notice a problem.
- Tour, Part H — the same answers in narrative form.