concept-graph-xai
SHAP, told the way your model committee actually argues.
concept-graph-xai answers: which concept did the model lean on, and was that concept
the right thing to lean on at all? You bring the business-concept hierarchy; the
library reshapes every per-feature interpretability signal — importance, utilization,
interactions, ablations, drift, per-group fairness — through it.
Alpha
v0.6.1 is an alpha release; the API may change between minor releases. The metric
layer (metrics/*) and plot layer (plotting/*) are stable and independently
testable; v1.0 will add DAG support with optional per-edge weights
(roadmap).
from concept_graph_xai import ConceptGraph, importance_sum, sunburst
from concept_graph_xai.adapters import from_feature_importances_

graph = ConceptGraph.from_dict({
    "Risk": {
        "Demographics": ["age"],
        "Income":       ["monthly_income", "debt_ratio"],
        "Behaviour":    ["n_30_dpd"],
    },
})

importances, feature_names = from_feature_importances_(model, X.columns.tolist())
imp = importance_sum(graph, feature_names, importances)
sunburst(graph, imp, value="importance_sum", title="Concept importance").show()
The gap
A SHAP plot tells you which features moved a prediction. A model risk committee, a fairness review, or a regulator asks something different: which concept did the model lean on, and was that concept the right thing to lean on at all?
monthly_income, debt_ratio, and revolving_utilization are not three independent
levers — they are three windows onto Income + Utilization. n_30_59_dpd,
n_60_89_dpd, n_90_plus_dpd are not three independent features — they are one
Delinquency signal at three time horizons. The hierarchy that matters is the one
your business, your ontology, and your regulator argue in. SHAP does not know about
that hierarchy. Auto-clustering tools (shap.utils.hclust, seaborn.clustermap) infer
a different hierarchy from the data — one that maximises correlation, not one that
mirrors PII vs. financial vs. behavioural vs. bureau-supplied.
That is the gap. You already have the hierarchy on a whiteboard, in a regulatory
submission, in a feature-store taxonomy. concept-graph-xai takes that hierarchy as
input and rolls every per-feature signal up through it.
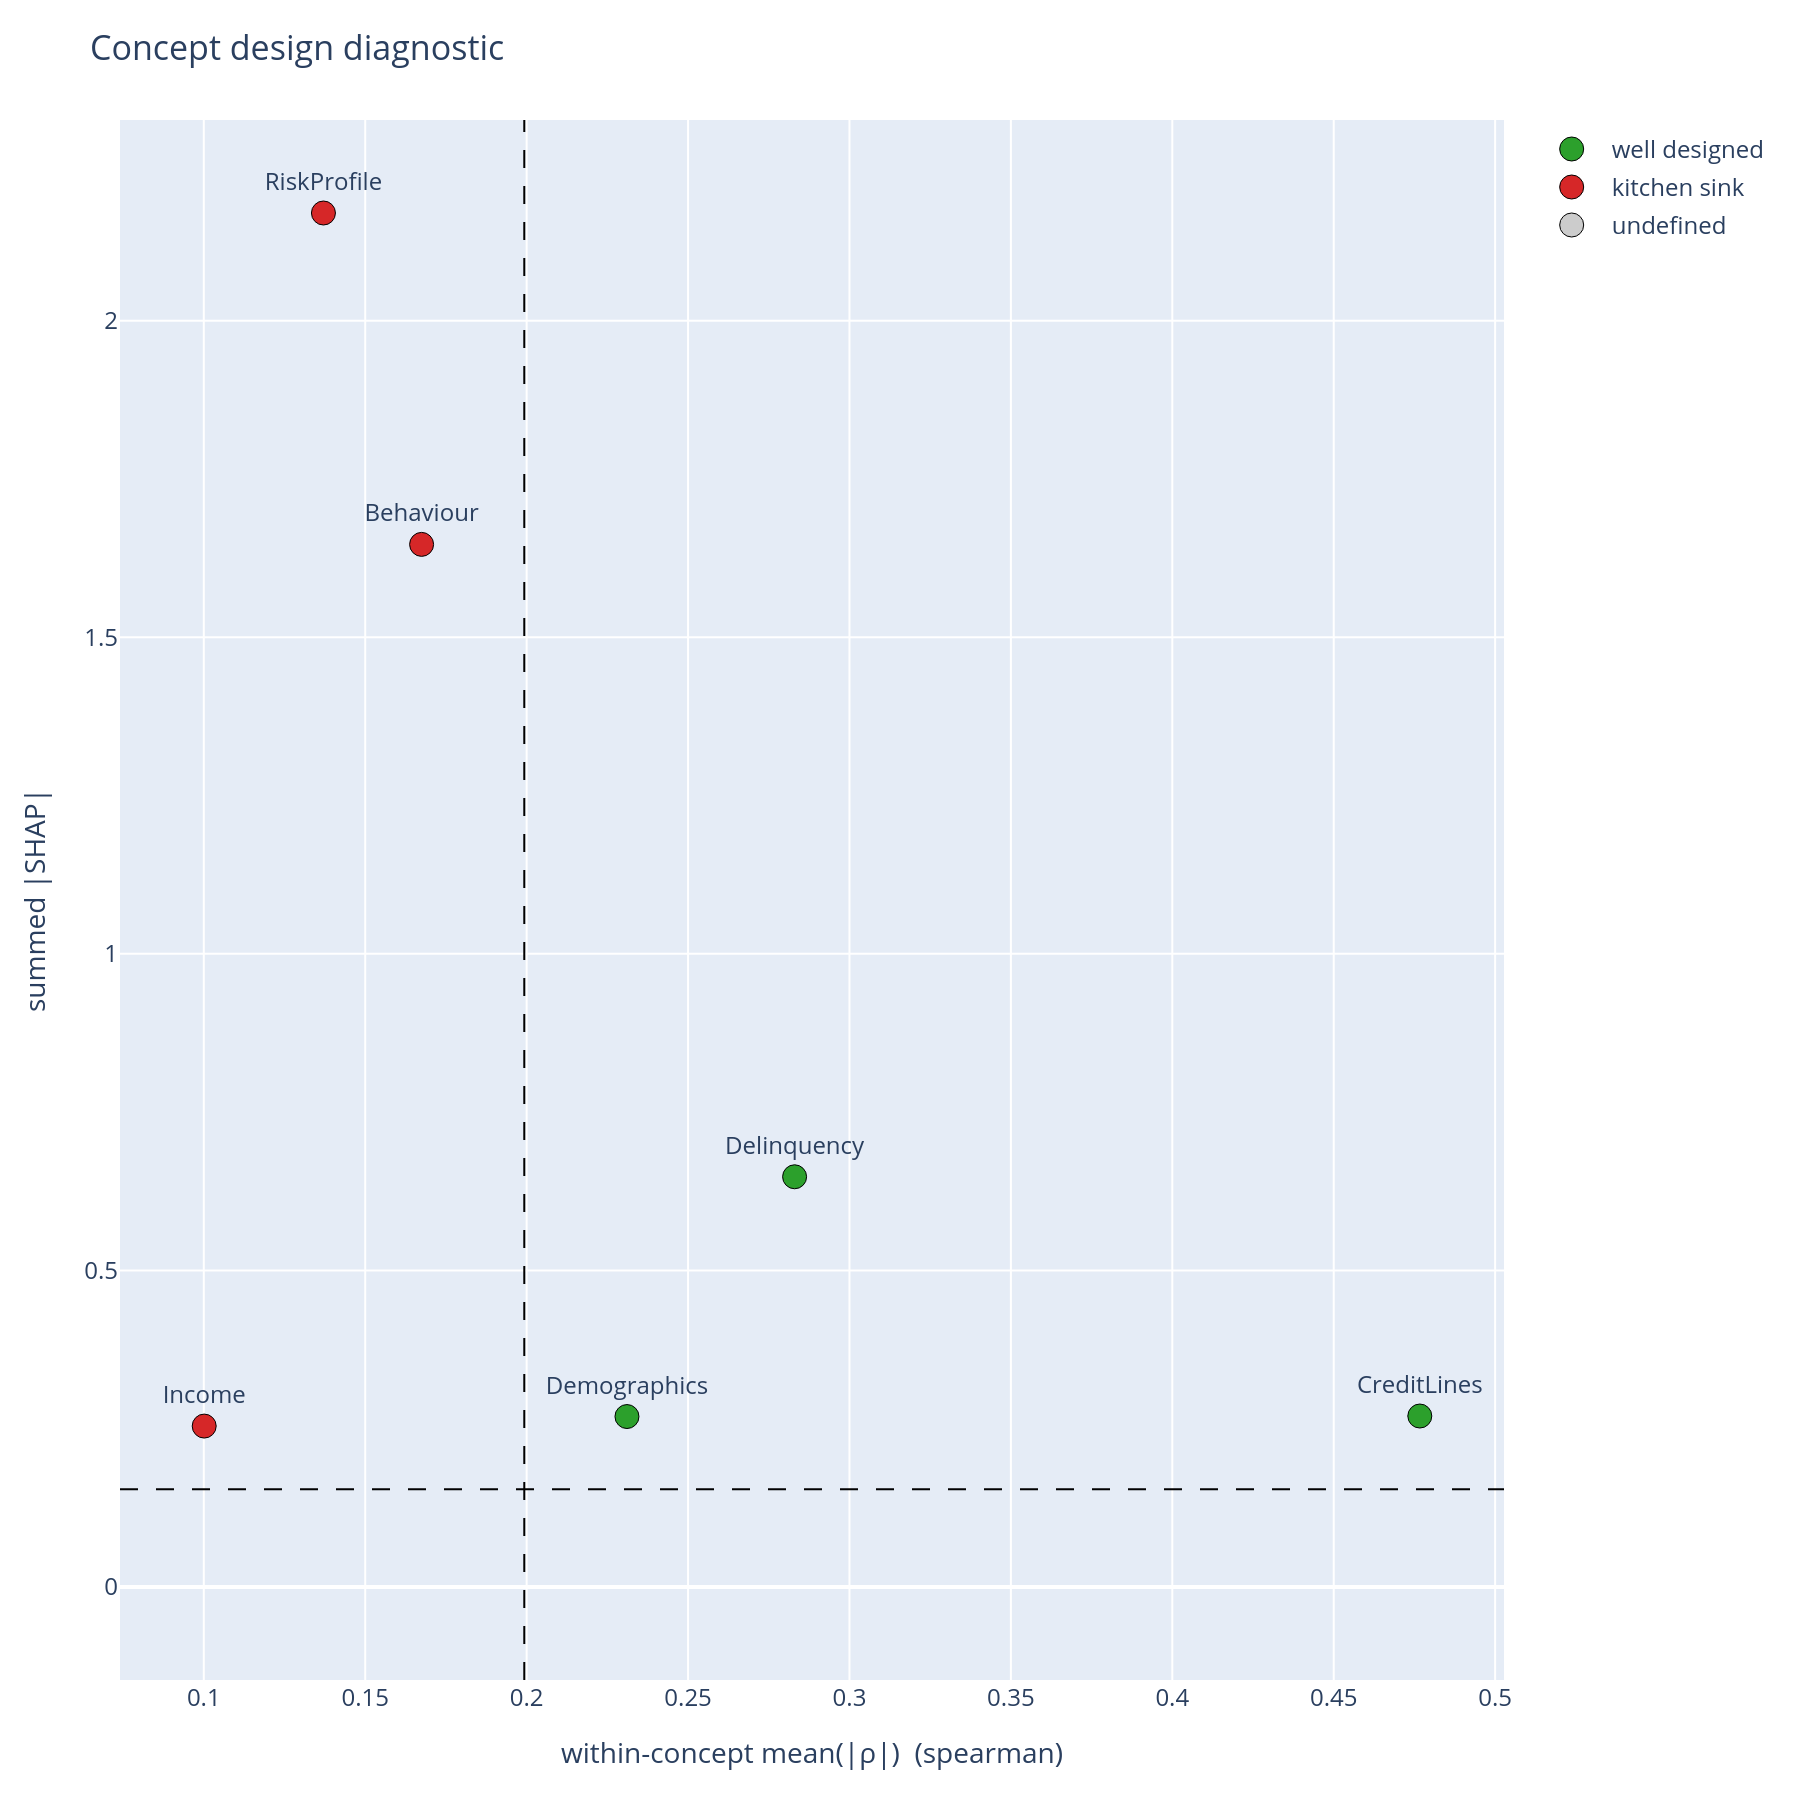
The single chart that no per-feature SHAP plot can produce: every concept in your tree placed on how coherent its features are against how much the model leans on it. The top-left quadrant is the danger zone — concepts the model relies on heavily but whose features look like three different things. Those are the concepts to split before the next review meeting.
Highlights
- Structure — which concepts the model uses and how much each carries: utilization and importance sunbursts, plus bootstrap confidence intervals on the ranking (structure and importance).
- Composition — concept × concept SHAP-interaction matrix and a feature → concept → ±outcome Sankey (composition).
- Per-prediction — concept violins and single-row concept waterfalls for adjudication and adverse-action notices (per-prediction explanations).
- Concept-design diagnostics — block-structured correlation matrices and the coherence-vs-importance quadrant scatter that says whether the tree itself is defensible (concept design).
- Cohort and fairness views — segment × concept heatmaps, per-cohort Pareto curves, and a concept disparity heatmap against a reference protected group (cohorts, fairness).
- Robustness — AUC drop under whole-branch ablation (three strategies) and concept-level drift across periods (robustness and drift).
- Strict layering — metrics return plain
pandas.DataFrames and never import plotly; plots take aConceptGraphplus a DataFrame and returnplotly.graph_objects.Figures, exportable to PNG viakaleido(concept graphs).
Where to start
- Getting started — install and your first sunburst in under a minute.
- How it works — one realistic credit-risk scenario end-to-end, from training a model to defending its concept structure.
- Credit-risk walkthrough — the same scenario as a runnable notebook, executed end-to-end on the Give Me Some Credit dataset.
- Concepts — the data model, then one page per workflow question.