Does importance differ across cohorts?
The model has one global behaviour described in structure. Operationally, it has several behaviours — one per segment (age bucket, geography, channel, vintage, …). The cohort view surfaces the differences.
When to use this
- When the population is not homogeneous and a single global importance ranking would mask sub-population behaviour.
- When investigating a quality regression in one segment to find which concept is driving the change.
- Before any fairness review — the cohort view is the legitimate-business-segment baseline against which protected-group disparities are interpreted.
The two views
| Function | Returns | Use for |
|---|---|---|
segment_importance + segment_concept_heatmap |
Long-form (concept, segment) → value | "Which concepts matter in which segments?" |
segment_importance + concept_pareto |
Cumulative-importance curves per segment | "Is the model concentrated on a few concepts in this cohort or spread across many?" |
Both use the same segment_importance metric; the difference is in
the plot.
Minimal example
from concept_graph_xai import (
    concept_pareto, segment_concept_heatmap, segment_importance,
)

# Define cohorts however you like — pre-existing column, computed
# series, or a fresh categorical you derive from X.
X["age_bucket"] = pd.cut(X["age"], bins=[0, 30, 45, 60, 120],
                         labels=["<30", "30-44", "45-59", "60+"])

seg = segment_importance(graph, feature_names, shap_values,
                         segments="age_bucket", X=X)

# Heatmap — full-grid view.
segment_concept_heatmap(seg).show()

# Pareto — concentration vs. spread.
concept_pareto(seg).show()
Reading the output
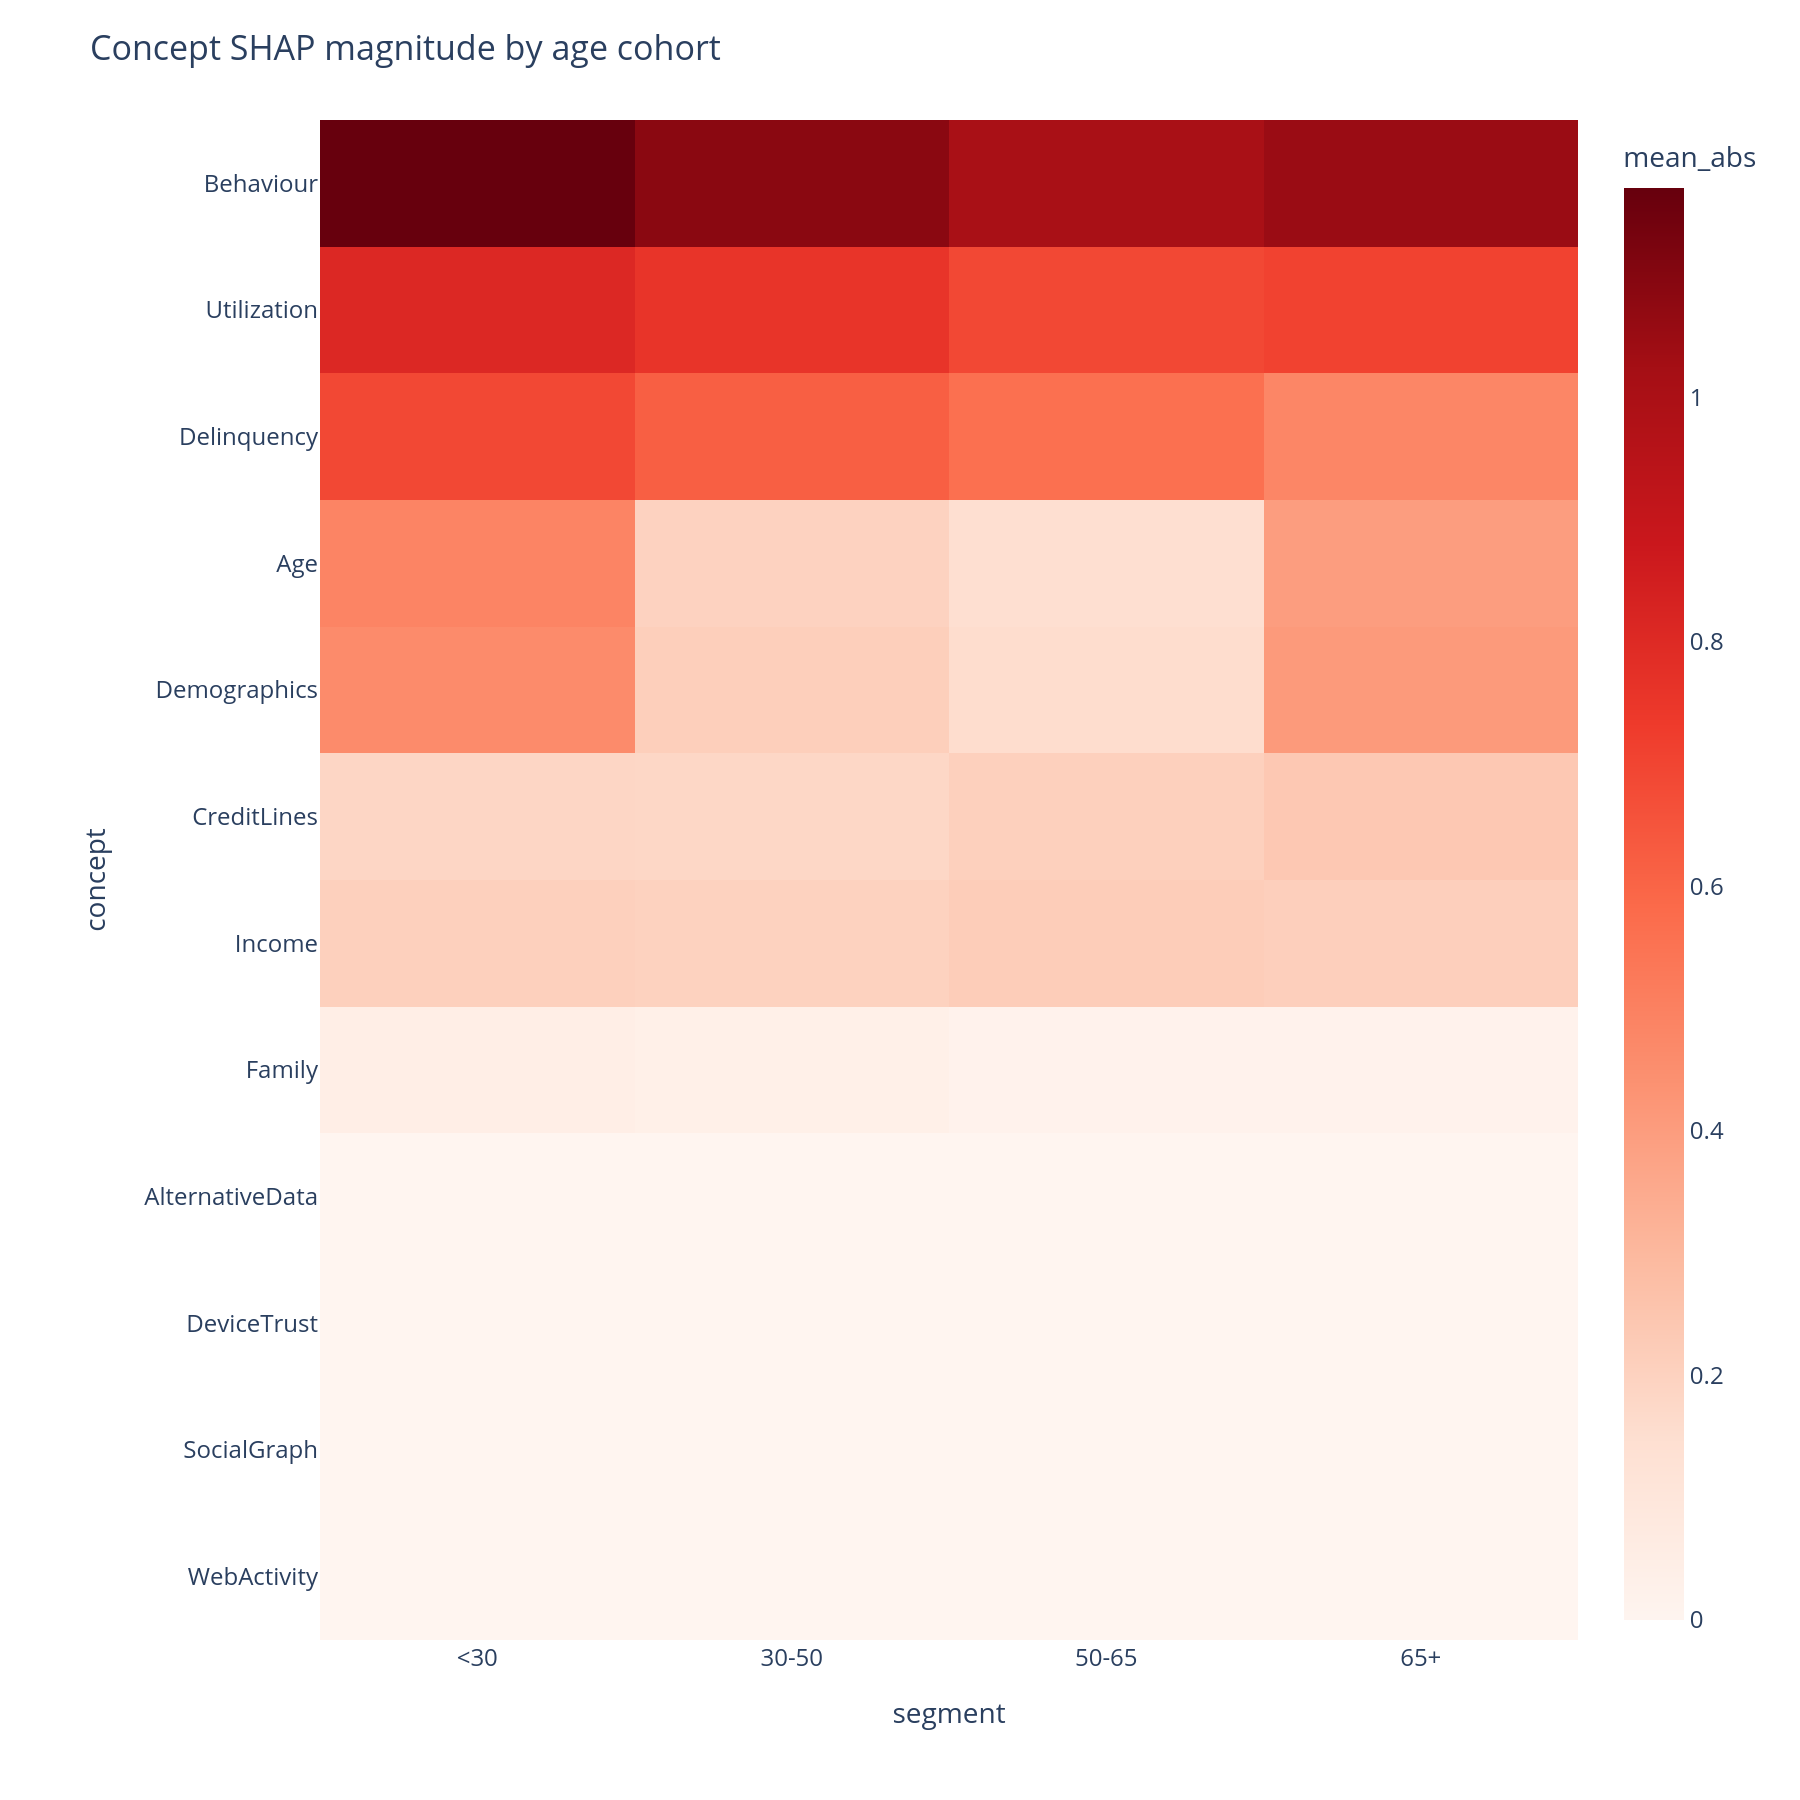
Segment × concept heatmap
Rows are concepts (DFS preorder). Columns are segments (in the order
of the categorical's categories, or first-seen if the segments
column is a plain object dtype). Cell colour is mean|SHAP|
contribution of that concept in that segment.
A row that is uniformly red means the concept always matters.
A row with a single dark column means the concept matters only
for that segment — often the most actionable finding, because it
points at a segment-specific behaviour the global view hid.
Hover gives the per-cell value and the concept's feature_count.
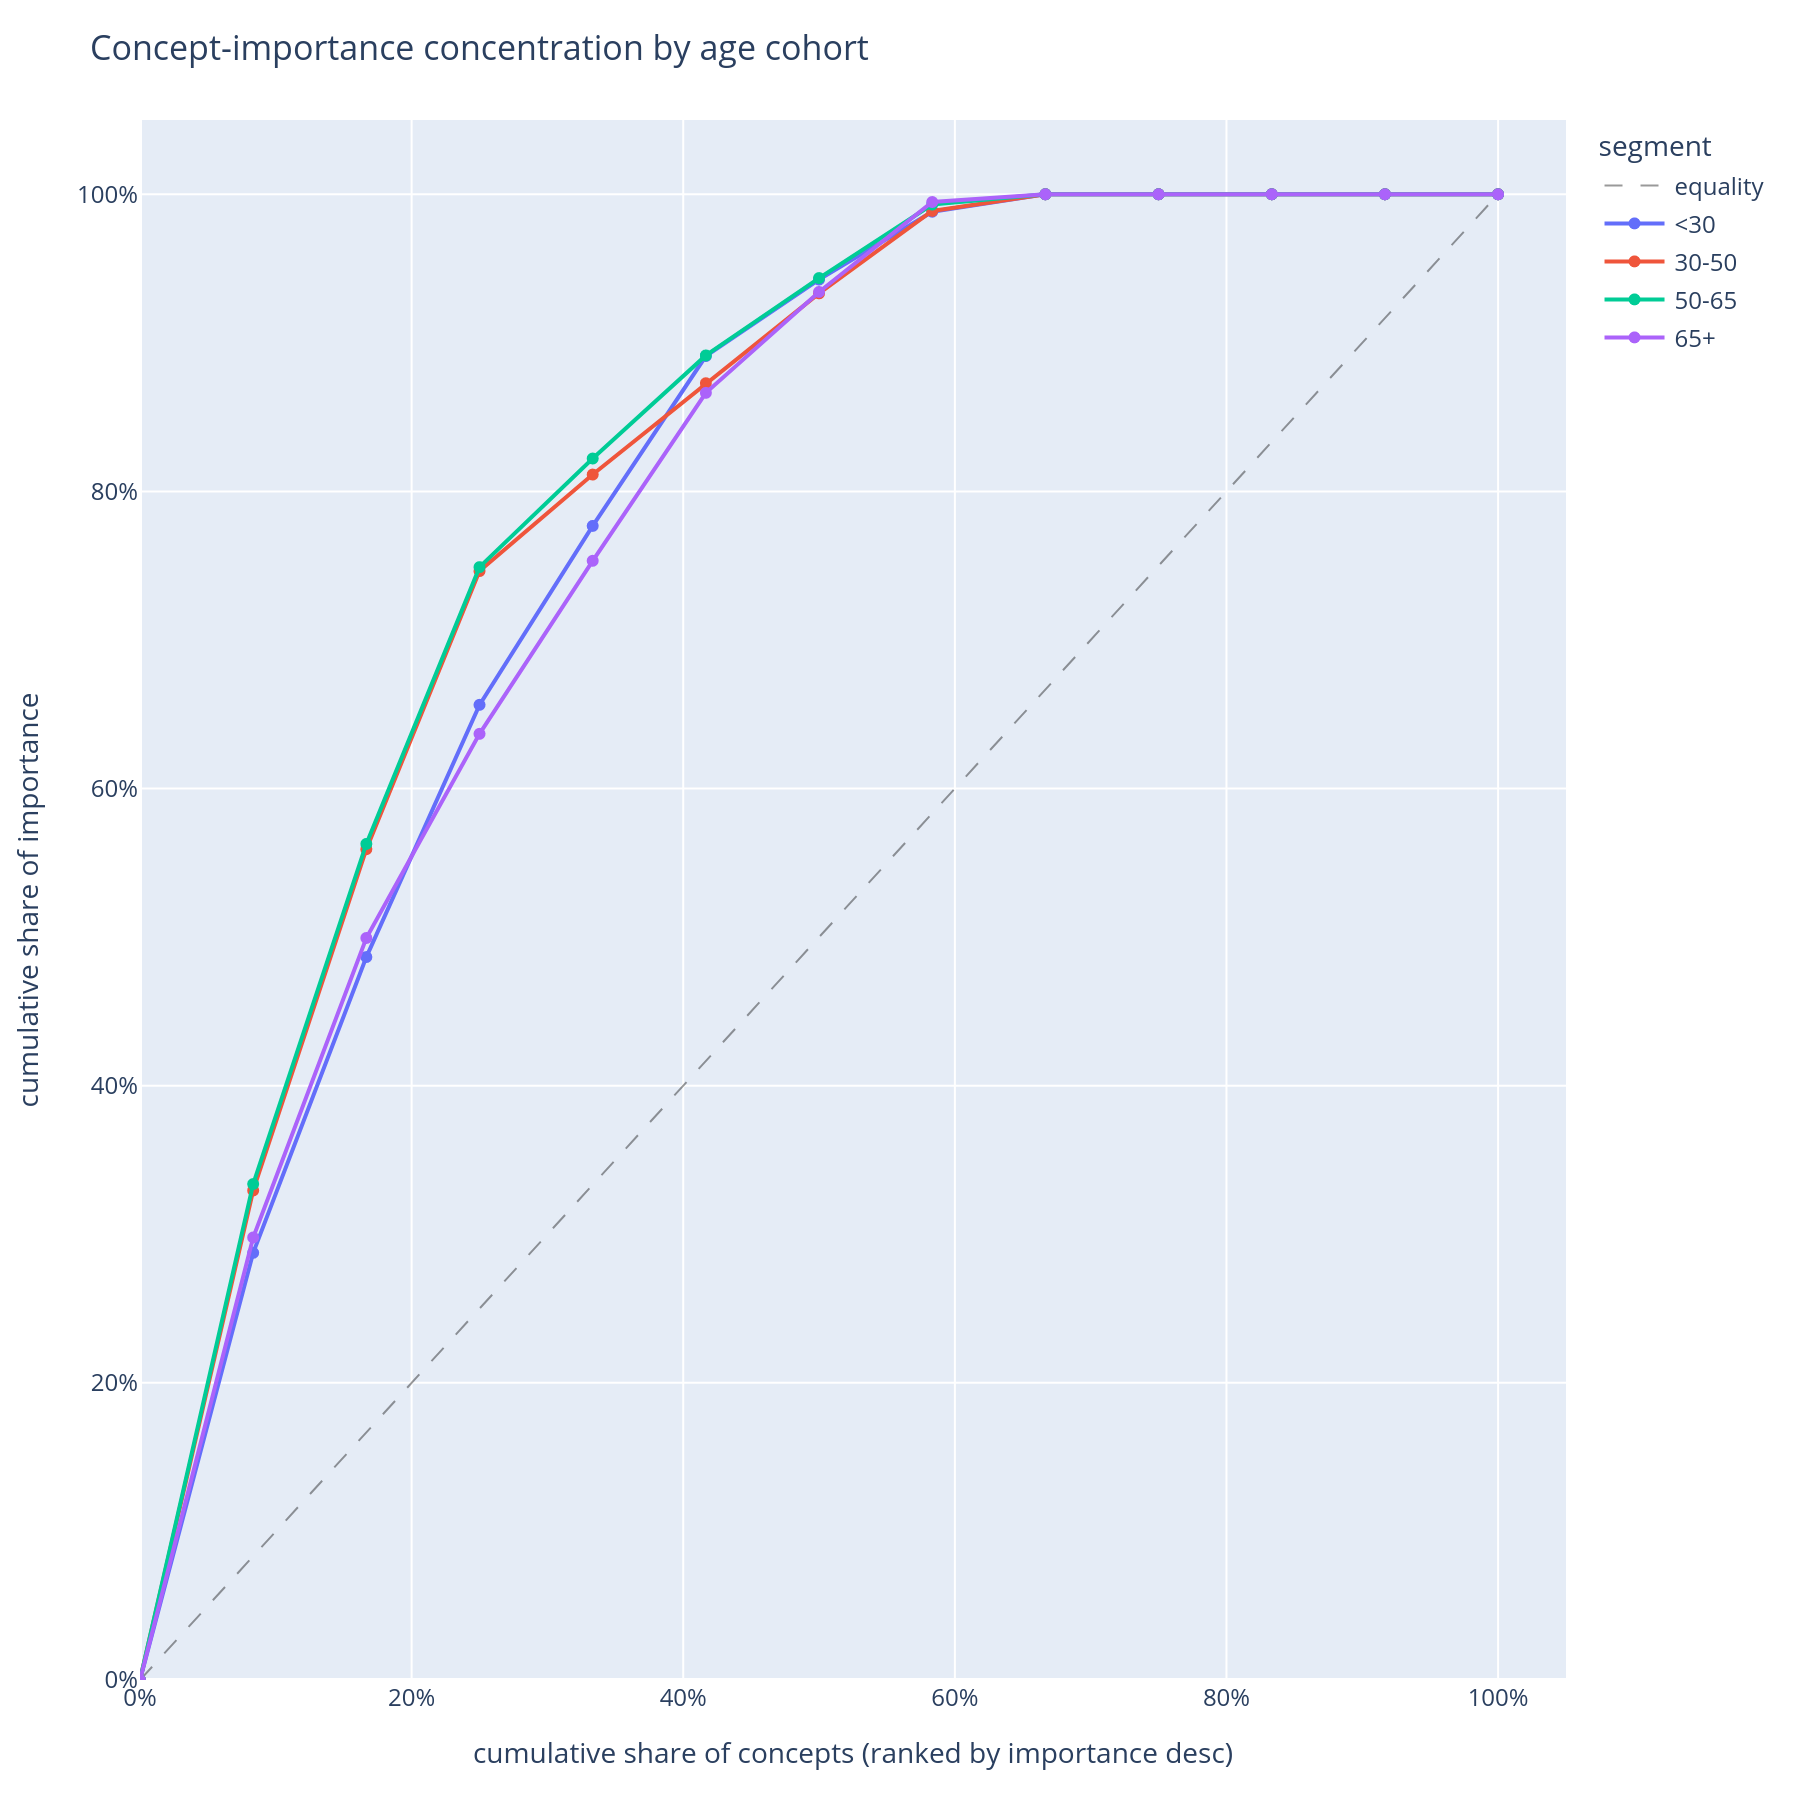
Pareto curves
One line per cohort. X = concept rank within cohort. Y = cumulative share of that cohort's total |SHAP|. A steep curve means the model is concentrated on a few concepts for that cohort; a flat curve means it spreads its attention.
Concentration is fragility: a model that depends on three concepts for the senior cohort is more brittle to those three concepts shifting than a model that depends on ten. The Pareto chart is the natural "diversification" axis for the operational-risk view.
What to do with the answer
- Open the heatmap on the segment that motivated the analysis (the regressing cohort, the new geography, the new channel) and look for the row whose colour profile is most different from the others — that is the concept the model uses differently for that segment.
- Pair the Pareto curves with the bootstrap importance intervals — a steep Pareto curve plus a wide CI on the top concept is the strongest "fragility + uncertainty" signal in the library.
- Carry the per-segment rankings into the robustness ablation: a concept that is critical in one segment is the one to retrain-ablate first.
Common pitfalls
- Segment definition matters. Buckets you compute from continuous
features (
pd.cut,pd.qcut) imply choices the heatmap will not visualise. Always inspectseg["segment"].value_counts()before reading anything off the heatmap — small buckets produce noisy mean|SHAP| estimates. - Categorical order.
segment_importancehonourspd.CategoricalDtype.categoriesfor ordered categoricals and falls back to first-seen otherwise. Set the order on the column before callingsegment_importanceif you want a specific column order in the heatmap. - Cohort vs protected attribute. This page is for cohorts that
are legitimate business segments (age, geography, channel). For
protected attributes (sex, race, marital status), the
fairness view (
concept_disparity) is the right call — its disparity computation is signed and pair-wise rather than mean across cells.
Related
segment_importance,segment_concept_heatmap,concept_pareto— API reference.- Fairness — the same row/column shape, different question.
- Tour, Part F — the same answers in narrative form.