Per-prediction explanations
Adjudication, adverse-action notices, and individual-case audits all need explanations for one specific row, not the population average. This page covers the two per-prediction plots.
When to use this
- When an adjudicator opens a case file and needs a single-page explanation of why the model scored this loan, this patient, this transaction.
- When writing the legal-required adverse-action notice that has to cite the top reasons for a decline.
- When stress-testing the model on the highest- and lowest-risk predictions to make sure the explanation reads sensibly at the extremes.
The two views
| Function | Returns | Use for |
|---|---|---|
concept_violin |
Per-concept distribution of row-level SHAP | "How concentrated vs. spread is each concept's contribution?" |
ConceptPredictionExplainer.waterfall |
Single-row contribution cascade | "Why this specific prediction?" |
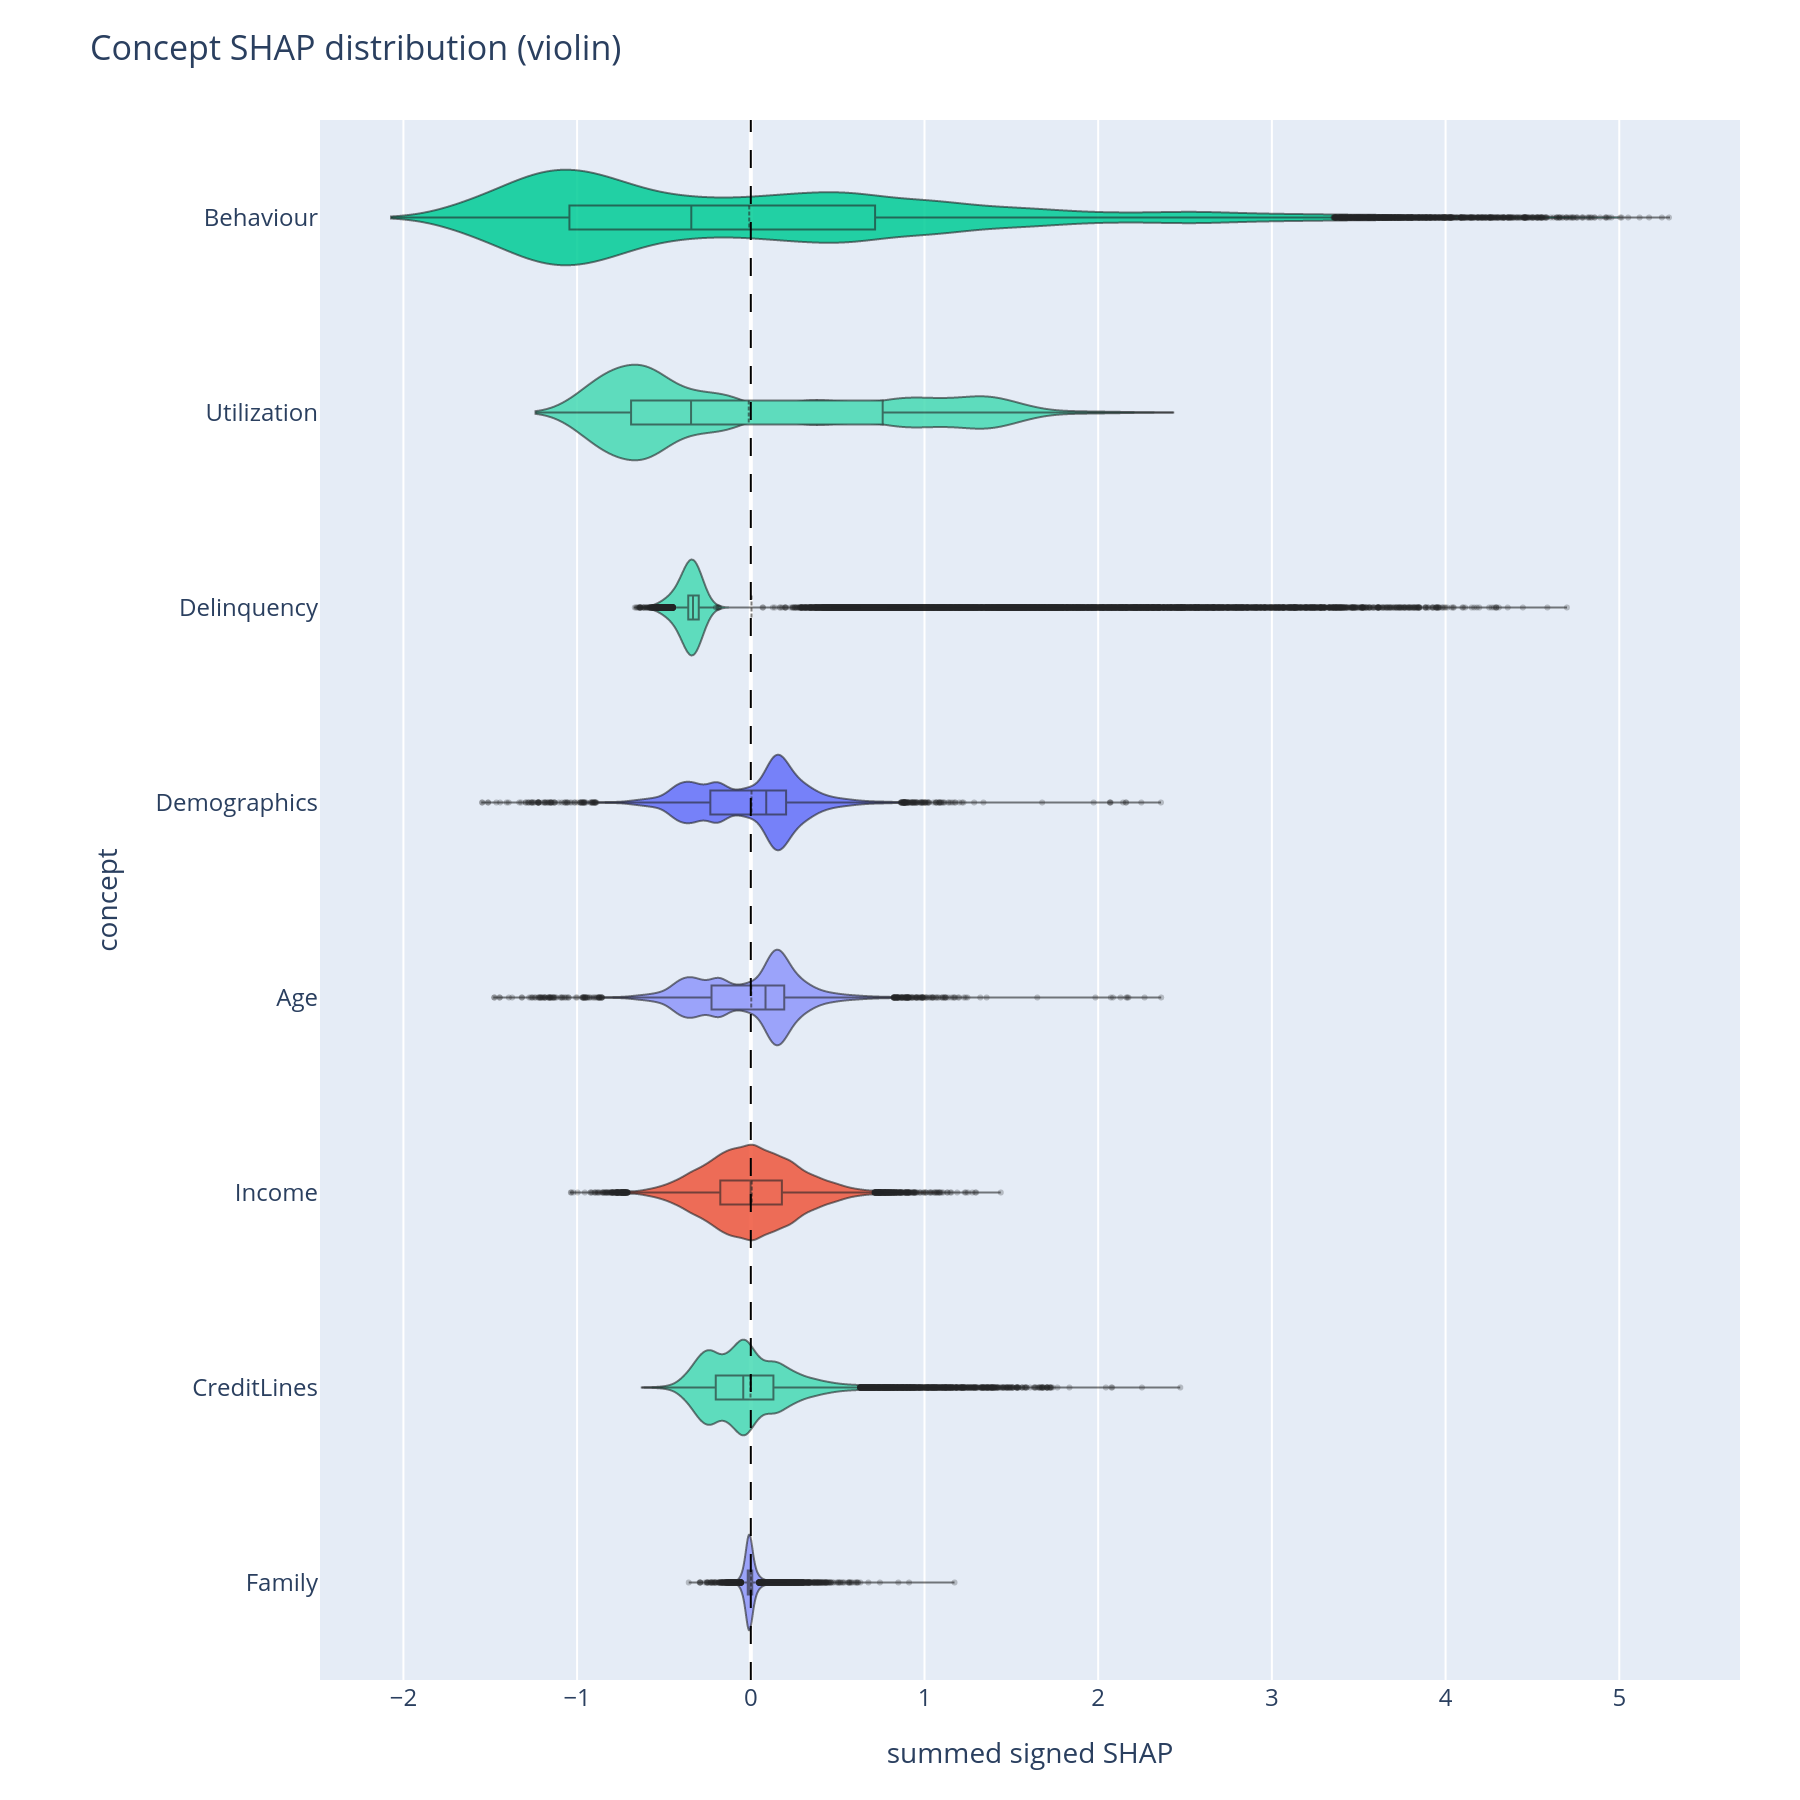
concept_violin is a population-level summary that prepares you to
read individual rows. waterfall is the actual single-row chart.
Minimal example
from concept_graph_xai import (
    ConceptPredictionExplainer, concept_violin,
)

# Population-level distribution
concept_violin(graph, feature_names, shap_values).show()

# Single-row explanation
explainer = ConceptPredictionExplainer(graph, model, X, shap_values,
                                       base_value=expected_value)

# Top-level waterfall for the highest-risk row (depth=1 is the default)
highest_risk_idx = predictions.argmax()
explainer.waterfall(highest_risk_idx).show()

# Same row, one level deeper (Delinquency vs Utilization instead of Behaviour)
explainer.waterfall(highest_risk_idx, depth=2).show()
Reading the output
Violin
Each violin is one concept; width at a given y-value is the density of rows with that concept-level SHAP contribution. A long thin tail means the concept is normally quiet but occasionally swings the prediction by a lot. A tight cluster around zero means the concept rarely matters at the row level even if its importance_sum is non-zero.
Reading order matters: concepts are sorted by mean|SHAP| (highest first) so the top violin is the dominant population-level contributor.
Waterfall
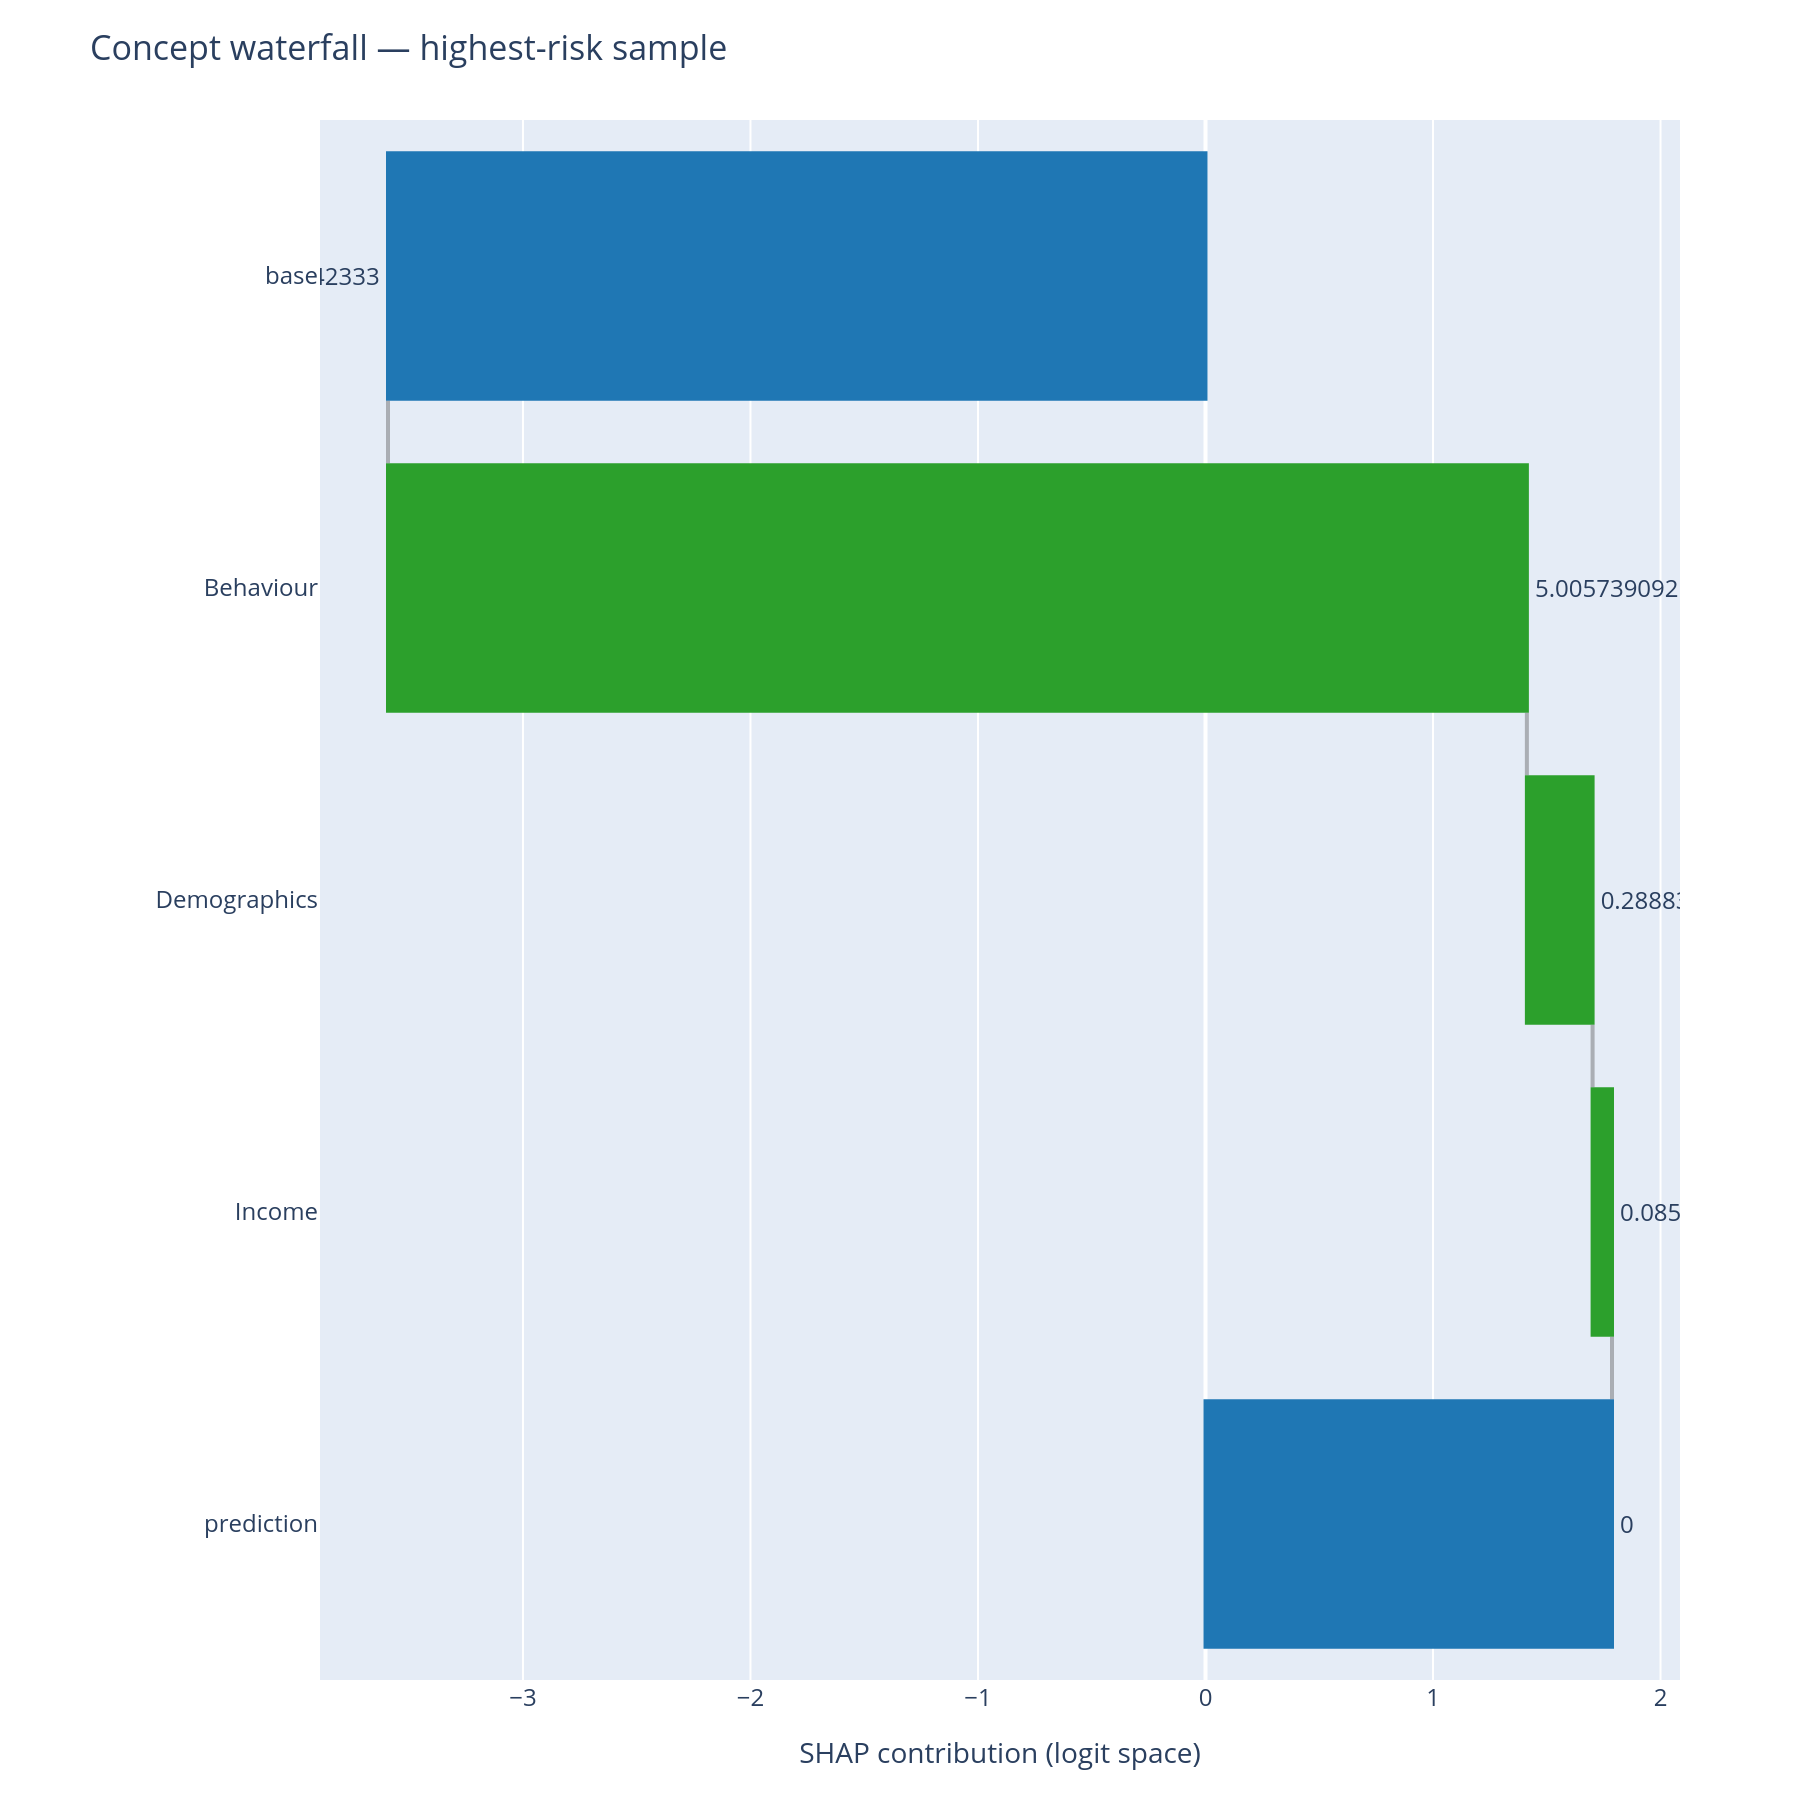
The classic SHAP waterfall, lifted to the concept level:
- Top bar = the model's base value (the expected log-odds before any feature is observed).
- Each bar = one concept's row-level signed contribution (its descendant features' SHAP values summed).
- Bottom bar = the model's predicted logit for this row.
depth picks the tree level to roll up to: depth=1 (the default)
shows the top-level concepts — useful when the adjudication audience
cares about Income vs Behaviour; depth=2 descends one level, to
Behaviour > Delinquency vs Behaviour > Utilization, and is the right
call for the follow-up "why was Behaviour so dominant?".
Green bars push the prediction up, red bars push it down.
What to do with the answer
- Use
depth=1waterfalls in the adjudication packet — they read naturally as a one-paragraph English sentence: "the model declined this loan because Behaviour was the dominant push, with Income partially offsetting". - Use deeper
depthvalues for the regulatory case file where the finer-grained concepts must be cited, or when the reviewer asks a follow-up: "why was Behaviour so dominant?". - Validate the chart on the extreme rows first
(
predictions.argmax(),predictions.argmin()) — if the explanation reads oddly at the extremes, the tree is probably mis-shaped and the concept-design diagnostics will say where.
Common pitfalls
base_valuematters. Pass the sameexpected_valuethat your SHAP explainer returned (e.g.explainer.expected_value). The waterfall is meaningless without it because the base + sum-of-bars identity is what makes SHAP additive.- Row index vs row label. An
introwis the positional index intoX/shap_values; a stringrowis looked up as a label inX.index. An out-of-range position raisesIndexError; an unknown or non-unique label raisesKeyError. - Categorical features. If your model trained on one-hot encodings, each level is a separate feature carrying its own SHAP value. Group the levels in the concept tree by giving the category as a concept and the levels as its features — the waterfall will then report them as one concept bar.
Related
- Composition — the population-level Sankey from which the row-level waterfall is the per-row slice.
- Cohort — when an explanation looks unusual, the cohort view often reveals it as a segment-specific behaviour rather than a bug.
- How it works, Part D — the same answers in narrative form.