Missing values
The robustness ablation tells you what the model
would lose if a concept's data disappeared. That number is only as
alarming as the scenario is realistic — and realism is an empirical
question about your data: how often is a single feature missing, and
how often does a whole branch go dark at once? The missingness
metrics answer it directly from X.isna(), no model required.
When to use this
- Before quoting any
auc_dropnumber in an operational-risk register, to check whether the "whole branch missing" scenario ever actually happens. - When on-boarding a new data vendor or feed, to see which concepts depend on columns that arrive patchily.
- During tree design, together with the concept-design diagnostics: features that go missing together are strong evidence they belong under one concept (they usually share an upstream source).
The three views
| Function | Returns | Use for |
|---|---|---|
column_missing_rate |
Per-feature missing rate, plus a per-concept any-missing rate | "Which columns are patchy at all?" |
joint_missing_rate + joint_missing_map |
Per-concept fraction of rows where every feature under the concept is NaN | "How often does the whole branch go dark at once?" |
nullity_correlation + correlation_block |
Block-structured correlation matrix on X.isna() |
"Do features go missing together, and along concept boundaries?" |
All three are model-free: they take the graph and a raw pandas.DataFrame.
Minimal example
from concept_graph_xai import (
    column_missing_rate, joint_missing_map, joint_missing_rate,
)

# Per-feature and any-missing rates — the quick table view.
cmr = column_missing_rate(graph, X)

# Joint-missing rate per concept, rendered on the tree.
jmr = joint_missing_rate(graph, X)
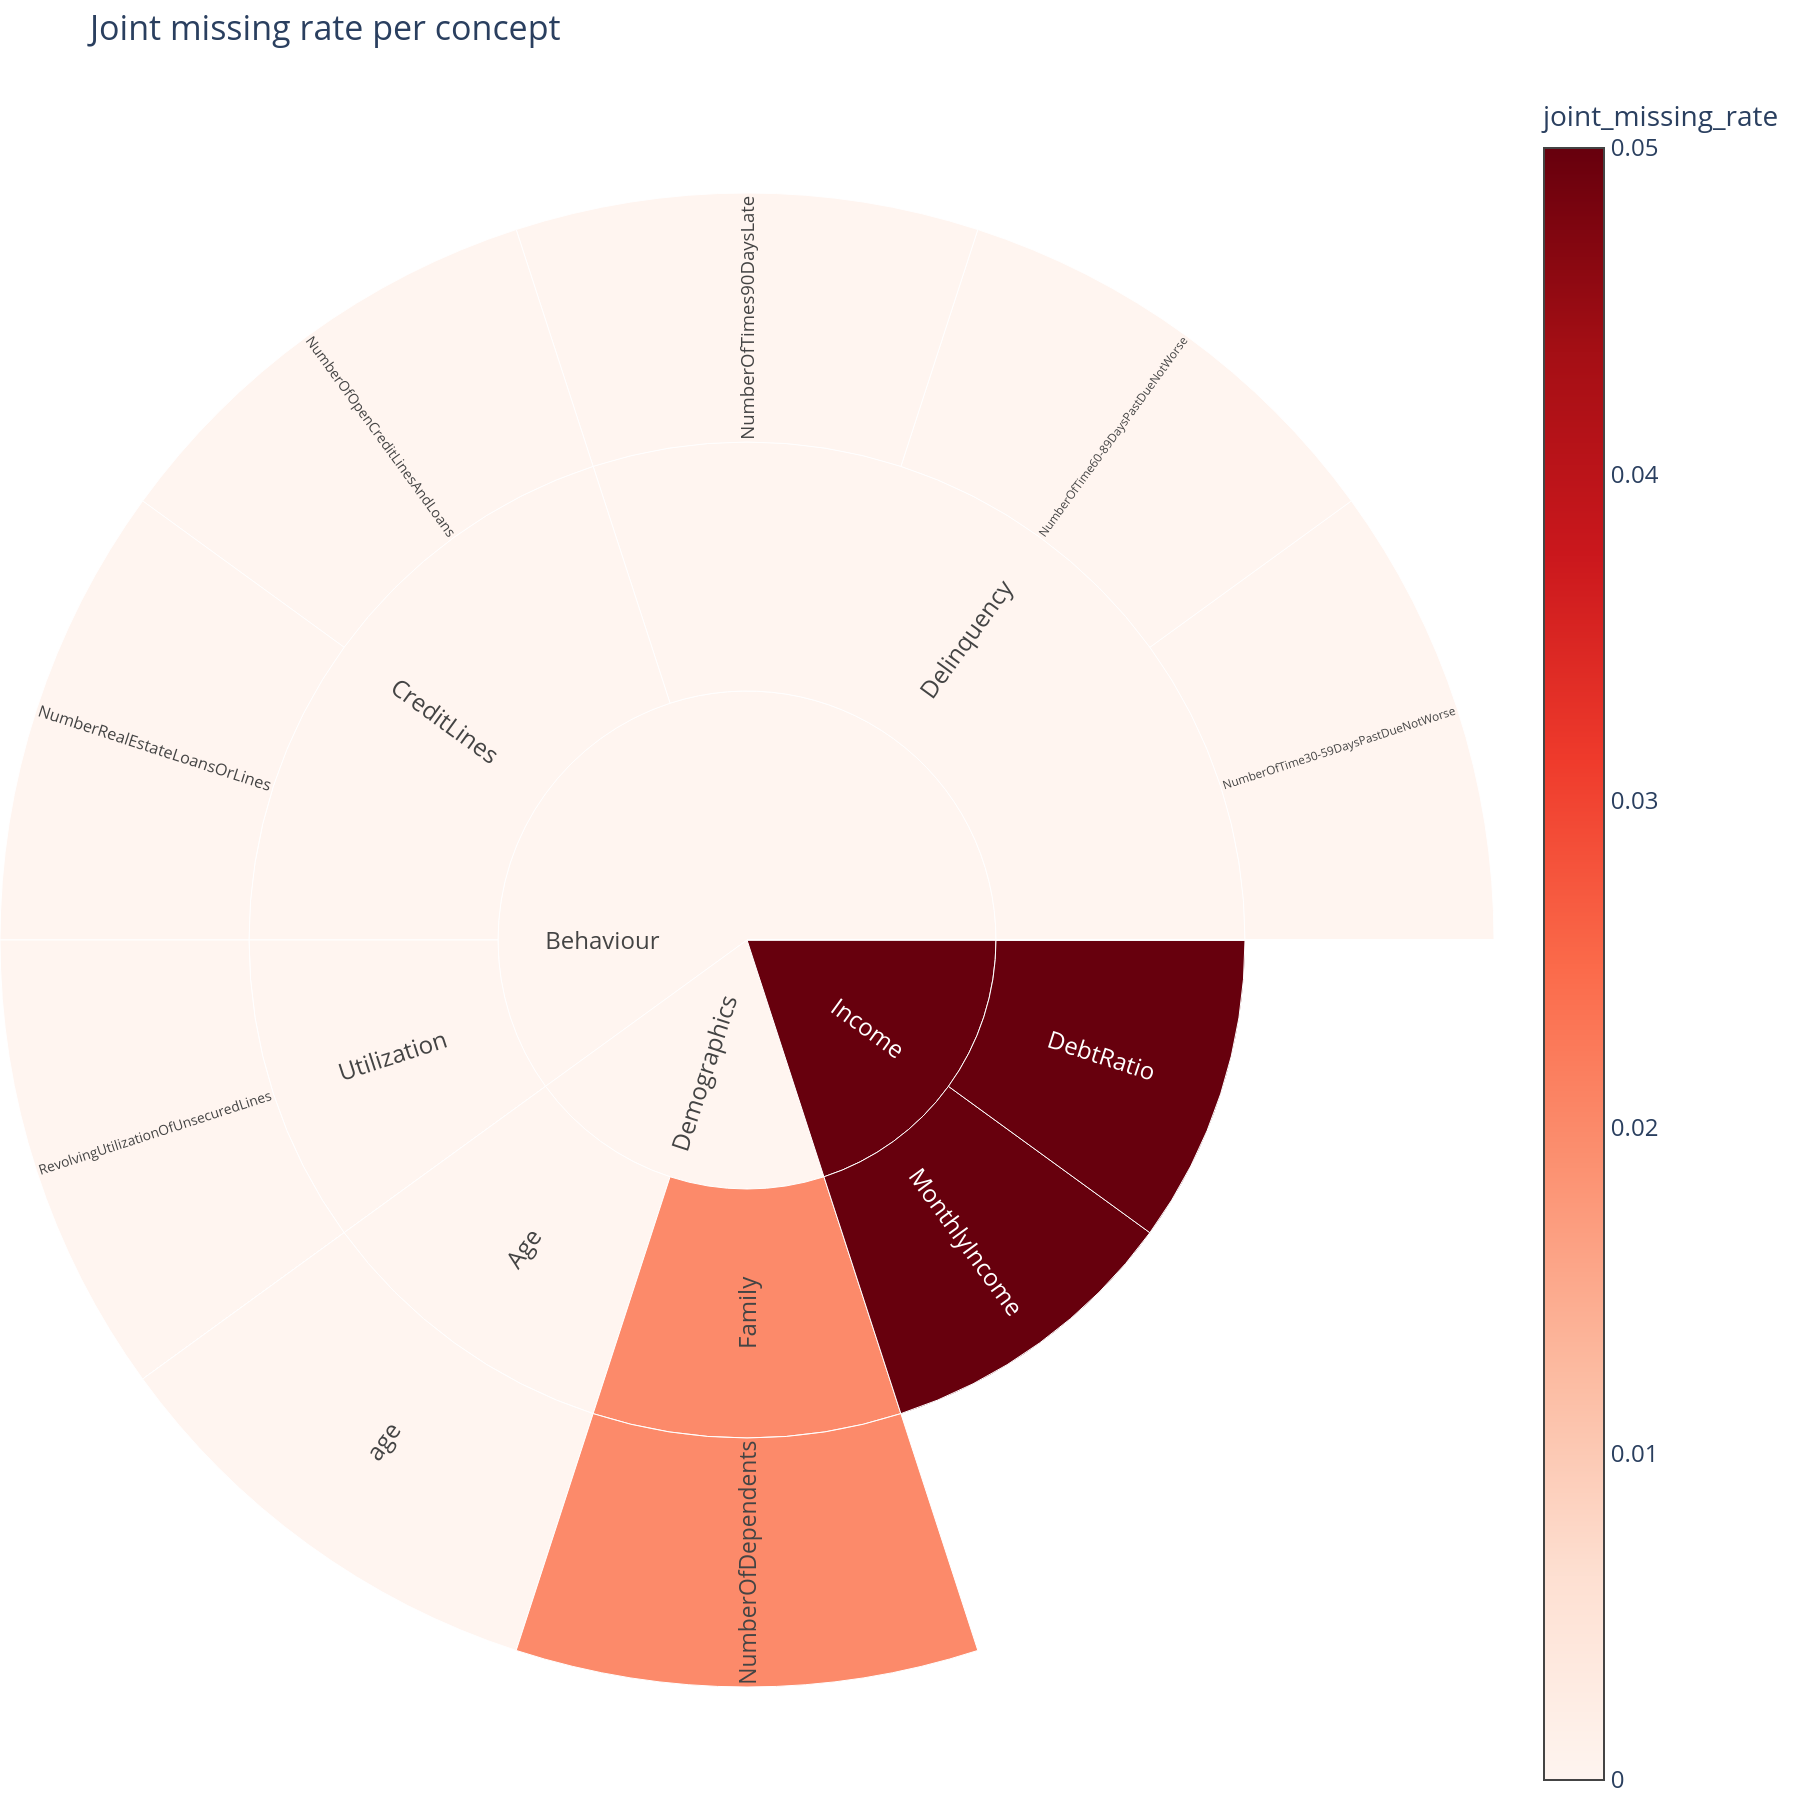
joint_missing_map(graph, jmr).show()
Reading the output
The three rates
For a concept \(c\) with descendant features \(F_c\) and \(n\) rows:
column_missing_rate is the per-feature mean(X[col].isna()); for a
concept node it is the mean of its descendant features' per-column
rates. The three always order as joint ≤ per-column mean ≤ any:
joint_missing_rateis the headline number — the fraction of rows where the concept contributes nothing. It is the rate that should drive the "is the AUC-drop scenario realistic?" judgement.any_missing_rate(a column ofcolumn_missing_rate's output) is the weak upper bound — at least one feature under the concept is missing. A large gap between any and joint means outages are feature-by-feature, not branch-wide.- Both frames carry the standard
name/kind/depth/parentcolumns andfeature_count, indexed by the/-joined path, so they join trivially with any other metric.
The sunburst
joint_missing_map colours each sector by its
joint-missing rate (Reds by default, scale anchored at zero) while
sector size stays feature_count — so the shape matches the other
sunbursts and a small-but-always-missing concept still jumps out by
colour. Hover shows the exact rate and the feature count.
A dark top-level sector is the operational red flag: an entire branch — typically one vendor or one upstream system — routinely vanishes as a block.
What to do with the answer
- Weight ablation by realism. Merge
joint_missing_ratewithauc_droponpathand multiply — the robustness page shows the three-line join. The raw AUC drop is a "what-if"; the weighted number is an "expected loss". - Confirm the block structure. If a concept's joint rate is high, check the nullity-correlation block — a dark diagonal block confirms the features share a missingness mechanism (one feed, one form, one vendor).
- Feed the model-risk register. The concepts with both a non-trivial joint-missing rate and a non-trivial AUC drop are the rows worth an operational mitigation (fallback score, vendor SLA, retrain-without-branch playbook).
Common pitfalls
- NaN is the only missingness the metrics see. The rates are
computed with
pandas.isna. Sentinel encodings (-999,"","UNKNOWN") count as observed — convert them toNaNbefore calling, or every rate reads as zero. - Features absent from
Xare skipped, not counted as missing. A graph feature with no matching column inX.columnssimply drops out of the computation (a concept with no matching columns gets rate0.0). If the column is missing because the feed is gone, that is exactly the outage you are trying to measure — align the frame to the full schema first. - Training data understates production missingness. Training sets
are usually curated (rows with too many NaNs filtered out). Compute
the rates on a raw production slice, not on
X_train, before quoting them in an operational context.
Related
column_missing_rate,joint_missing_rate,joint_missing_map,nullity_correlation— API reference.- Robustness — the AUC-drop scenario these rates calibrate.
- Concept-design — the nullity-correlation block view and how to read it.
- Credit-risk walkthrough — the joint-missing sunburst on the Give Me Some Credit data (cell E.3).