Composition
Structure answered which concepts the model relies on. Composition answers how those concepts work together — which pairs interact, and how does the average prediction physically flow from raw column to decision.
When to use this
- After identifying the top-ranked concepts in Structure, to check whether any pair has a strong non-additive interaction.
- When preparing the model-report figure that shows the signal flow end-to-end — the Sankey is the most non-technical-friendly chart in the library.
- When debugging an interaction-heavy model where per-feature SHAP is misleading because pairs of features cancel out at the leaf level but the pair-as-a-concept does not.
The two views
| Function | Returns | Use for |
|---|---|---|
concept_interaction_matrix + concept_interaction_heatmap |
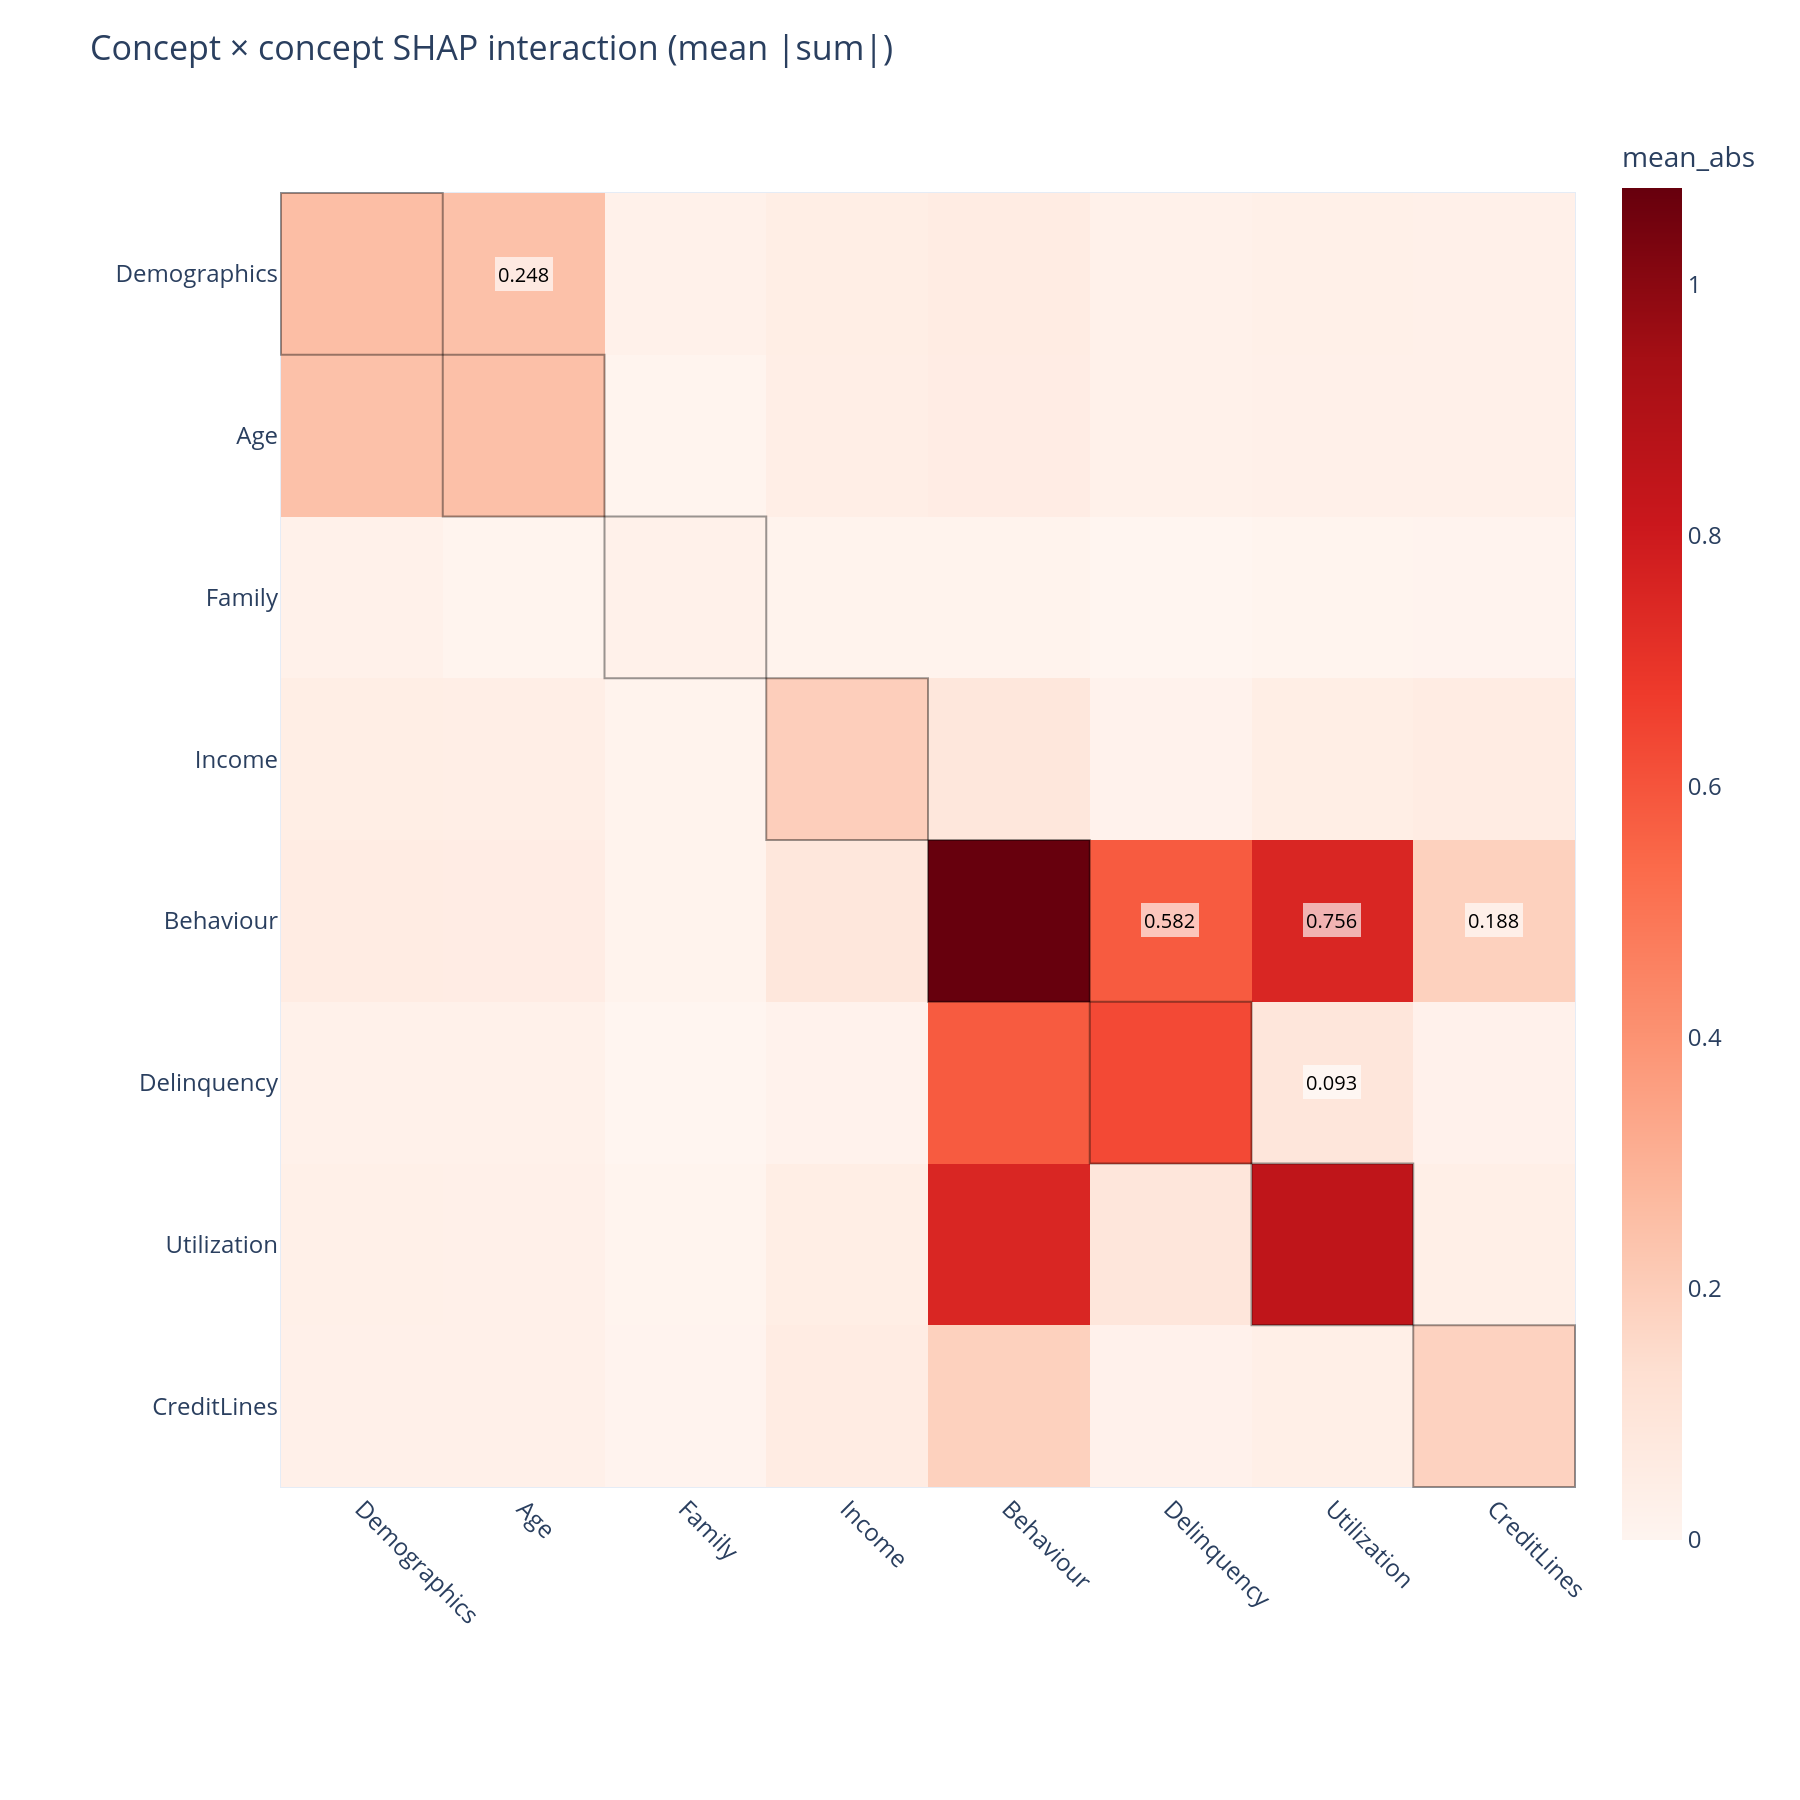
Concept × concept SHAP interaction matrix | "Do these two concepts have a non-additive signal?" |
concept_sankey |
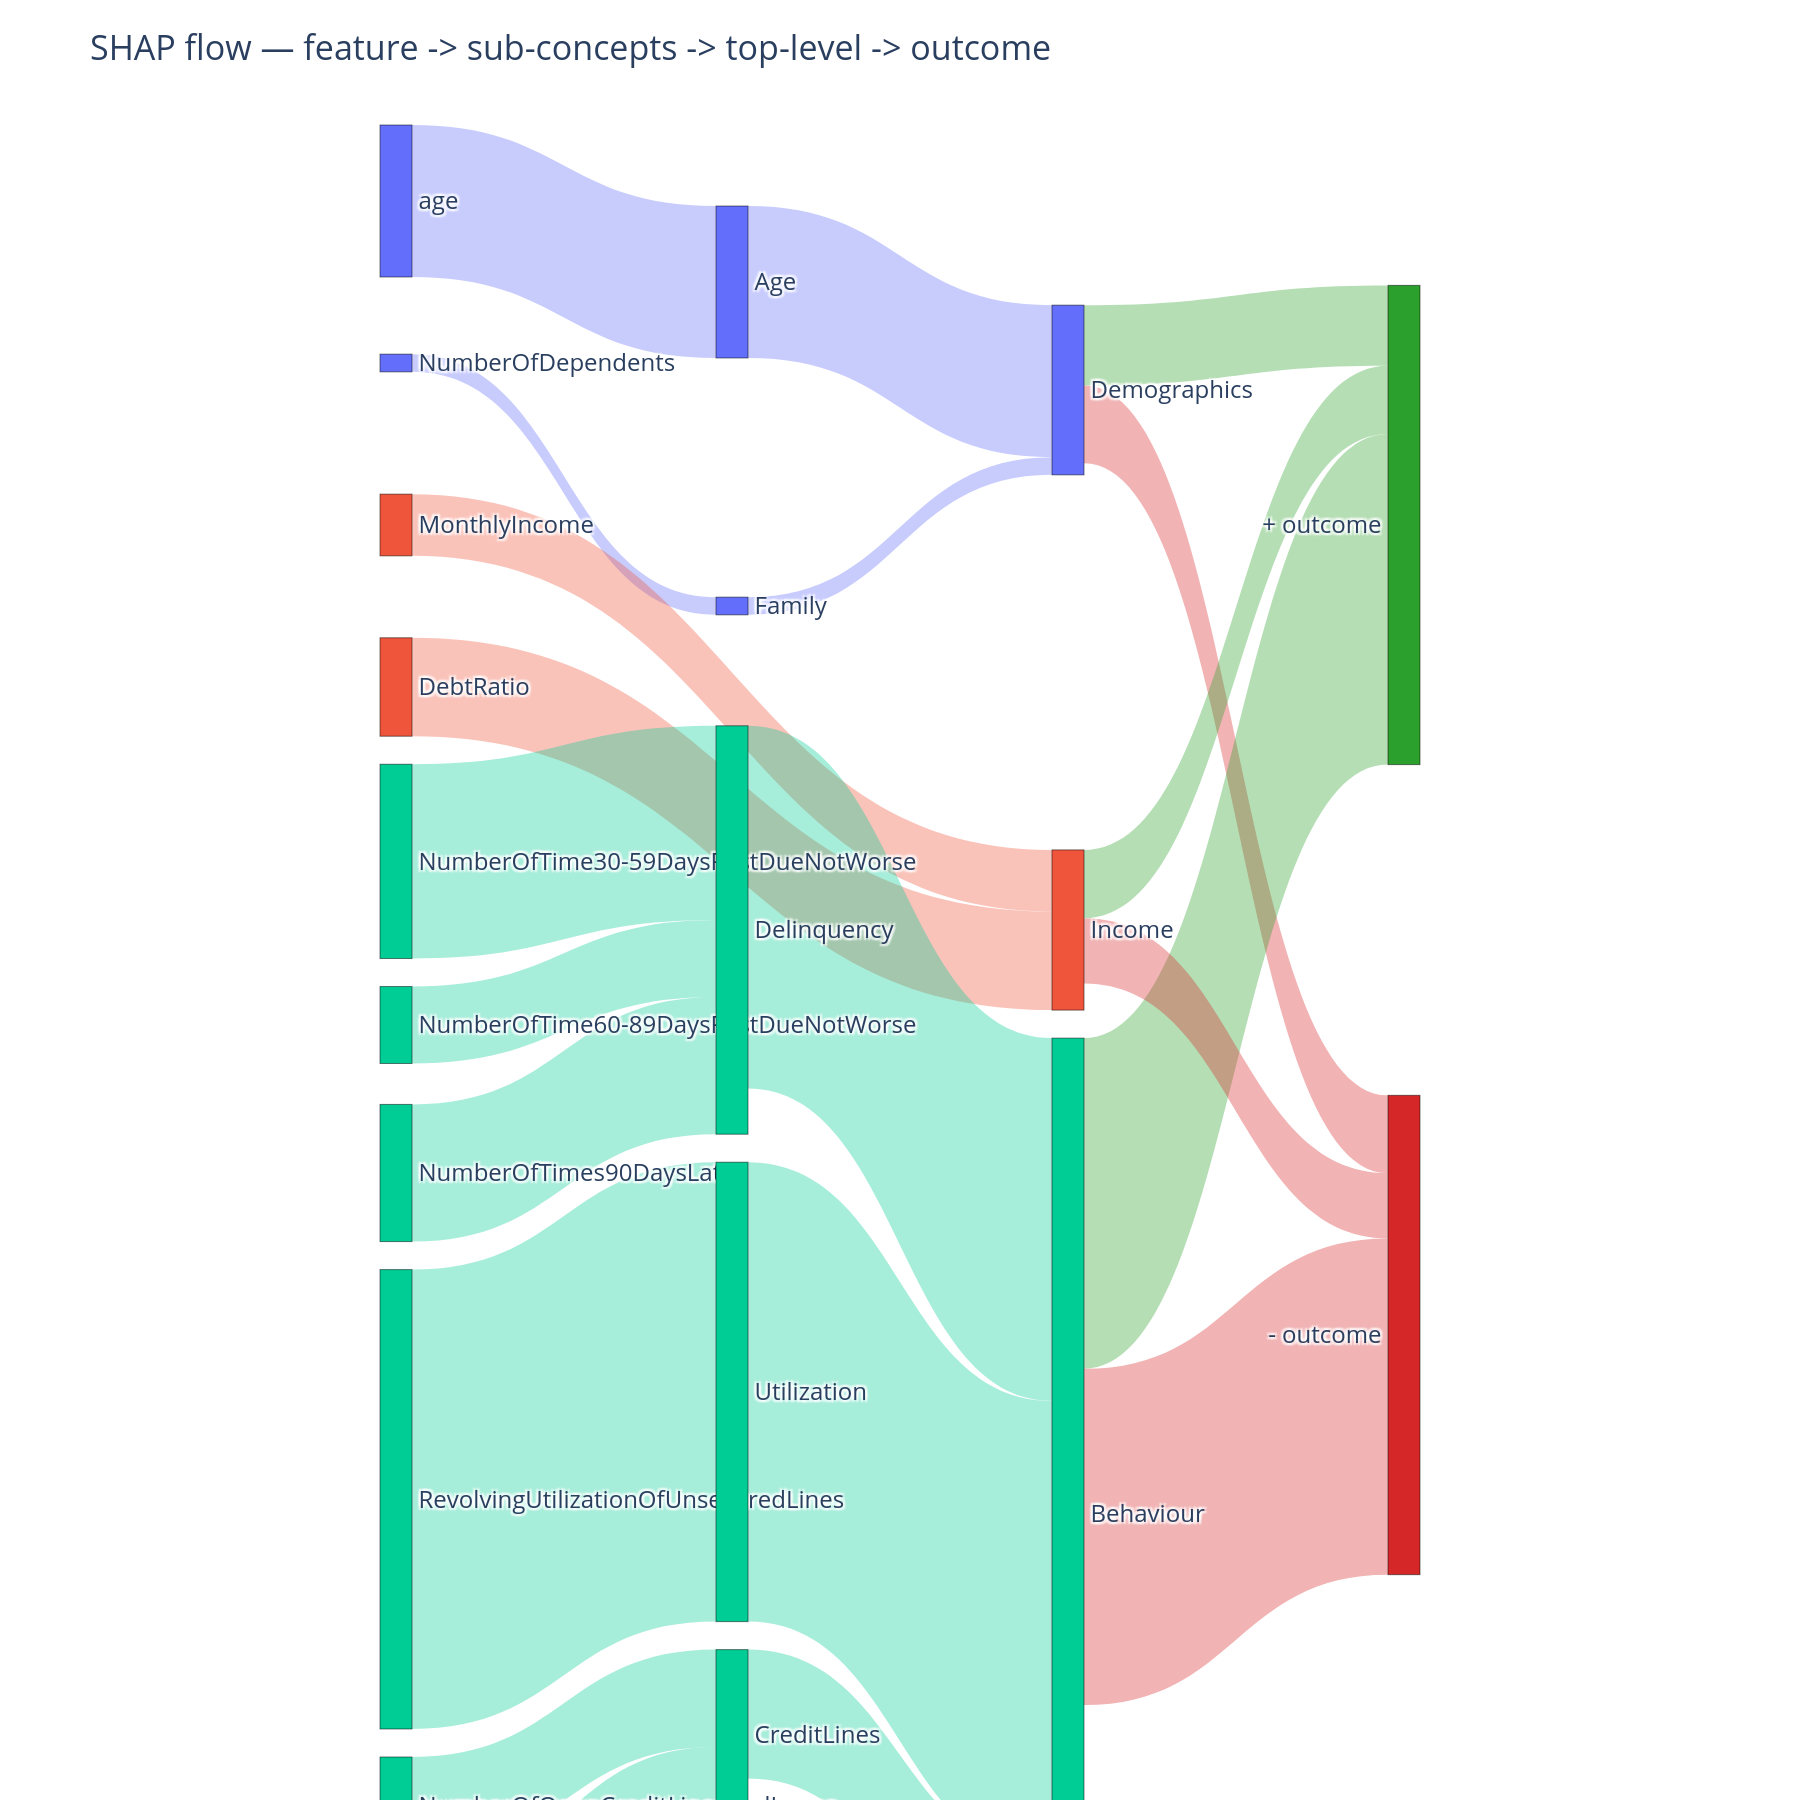
Multi-tier Sankey | "Where does the signal flow?" |
The interaction matrix needs a (N, F, F) SHAP interaction tensor —
expensive. The Sankey needs only (N, F) standard SHAP.
Minimal example
from concept_graph_xai import (
    concept_interaction_heatmap, concept_interaction_matrix,
    concept_sankey,
)

# Concept × concept interactions (needs interaction tensor)
inter = concept_interaction_matrix(graph, feature_names,
                                   shap_interaction_values)
concept_interaction_heatmap(inter).show()

# Feature → concept → ±outcome flow (needs standard SHAP)
concept_sankey(graph, feature_names, shap_values).show()
Reading the output
Interaction matrix
Cells aggregate per-sample SHAP interaction values up the tree:
- Diagonal cells = within-concept self-interaction. Non-zero means the concept's features interact with each other.
- Off-diagonal cells = between-concept interaction. Both halves are drawn (the matrix is symmetric) so the visual is unambiguous.
A large off-diagonal cell — Income × Behaviour, say — means a univariate "what does Income contribute" answer is incomplete; the contribution depends on behavioural context. That belongs in the model report next to the importance ranking.
A large diagonal cell with a small off-diagonal cell means the concept is internally non-linear but does not cross-react with other concepts — which is exactly what the tree was set up to find.
SHAP Sankey
Left: features. Middle: one tier per concept level, ordered
top-to-bottom in DFS preorder so siblings sit together — deep trees
produce multiple intermediate tiers (feature → sub-concept →
top-level concept). Right: the ±outcome bucket.
- Link width = summed magnitude of SHAP contribution along that edge.
- Link colour = inherits the top-level branch hue, so a single branch's flow is visually one stream from feature to outcome.
- Top-level concepts split their flow between
+outcomeand-outcome: the rows where the concept's summed contribution pushes the prediction up feed the+band, the rows where it pushes down feed the-band. - Concepts are placed at explicit
(x, y)coordinates so vertical order is deterministic (not the Plotly auto-arrange, which would re-order to minimise crossings).
What to do with the answer
- Pull the top-3 off-diagonal interaction cells into the model report under "non-additive effects".
- Use the Sankey as the one figure in a non-technical deck — it shows the whole pipeline in one frame.
- Cross-check with per-prediction explanations:
a concept with a large off-diagonal interaction will show a wide
concept_violinand a context-dependent waterfall.
Common pitfalls
- SHAP interaction values are expensive.
shap.TreeExplainercomputes them inO(F²)per sample. For 150k rows × 50 features this is minutes; for 1M × 200, this is hours. Sub-sample (N=2000is usually enough for the matrix to stabilise) or useshap.utils.sampleto build a representative subset. - Per-row Sankey misleads.
concept_sankeyaggregates over all rows. For a single-row view, use the concept waterfall instead — it answers the same question for one prediction.
Related
- Per-prediction — the same composition at the row level, where row-specific interactions become visible.
- How it works, Part C — the same answers in narrative form.