Validation report
Data these snippets assume
Blocks on this page use a fixed set of names for held-out data instead of re-deriving it each time. To run them, define the names first:
# docs: no-run — the definitions the snippets on this page assume
import numpy as np
from probcal import BetaCalibrator, Masterscale, make_pd_portfolio
from probcal.monitor import CalibrationMonitor

cal_set, new_set = make_pd_portfolio(n=3000, random_state=0), make_pd_portfolio(n=1000, random_state=1)
s_cal, y_cal = cal_set.scores, cal_set.y          # held-out calibration scores and outcomes
w_cal = np.ones_like(y_cal)                       # uniform sample weights
s_new = new_set.scores                            # scores of new obligors
ms = Masterscale.from_edges([0.01, 0.05], names=["G1", "G2", "G3"])   # the masterscale
p_cal = BetaCalibrator().fit(s_cal, y_cal).predict_proba(s_cal)         # calibrated PDs
grades = ms.assign(p_cal)                                              # rating labels
segments = np.array(["seg-a", "seg-b", "seg-c"])[np.arange(len(s_cal)) % 3]  # segment labels
model = ...   # any object with predict_proba(X); the docs use a stub that reads X[:, 0]
mon = CalibrationMonitor(alpha=0.05)              # with a few batches of a calibrated forecast applied
Every block also names, in its first comment line, which of these it uses.
How-to; every number and figure in the validation document comes from the APIs documented in their own chapters (Metrics and tests, Visualization, CORP and score decomposition, Conservatism, Monitoring). This page covers only assembling them into one document.
Open a full sample report: every section switched on, over the twelve-cohort drift scenario the monitoring chapter plots. It is a single self-contained HTML file, so the link is the whole artifact.
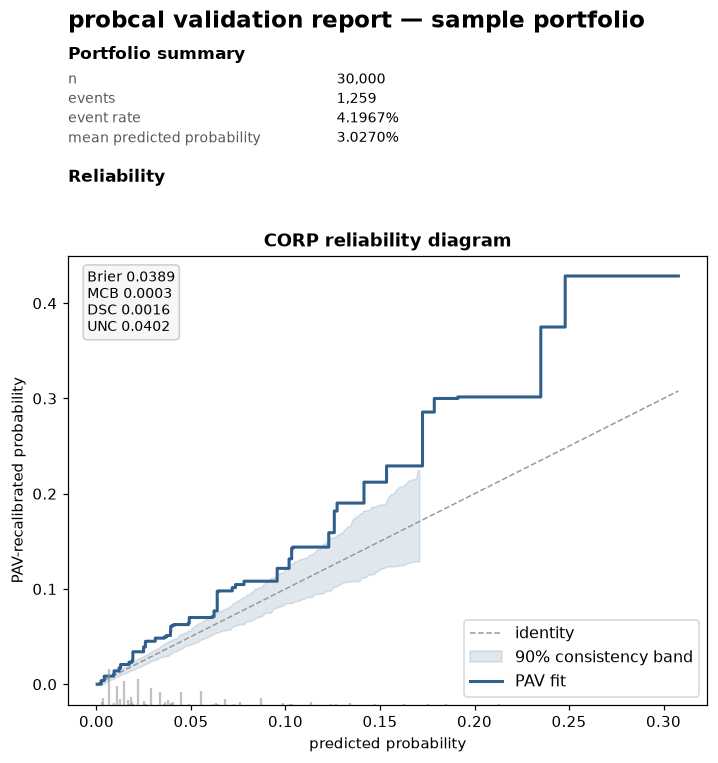
Regenerate it deliberately, not on every build:
uv run python docs/scripts/generate_sample_report.py.
# mon, ms, segments: a CalibrationMonitor with earlier batches applied, the masterscale, segment labels
# s_cal, y_cal: held-out calibration scores and outcomes
from probcal import BetaCalibrator
from probcal.report import validation_report   # probcal[viz]

cal = BetaCalibrator().fit(s_cal, y_cal)

html = validation_report(
    y_cal, s_cal,
    calibrator=cal,        # optional: adds the appendix (to_json + interpret())
    monitor=mon,            # optional: adds the e-process trajectory section
    grades=ms,              # optional: adds the grade table and Jeffreys/Pluto-Tasche section
    by=segments,            # optional: adds the grouped-evaluation section
    n_boot=50, seed=42,     # one shared knob for every resampling site
                            # (50: reduced for the docs harness; use 200+)
    path="validation.html",
)
With a Masterscale in grades, the rating-grades section opens with its
grade table, the grades are ordered by the scale, and the scale's fingerprint
joins the header next to the data, calibrator, and monitor fingerprints
(your own masterscale). A plain label
array still works and orders grades by mean predicted probability.
Sections are omitted, not left blank, when their input is absent:
reliability, the metric report, and the CORP decomposition always appear
(they need only y/scores); the rating-grades, grouped-evaluation,
monitoring, and appendix sections appear only when grades, by,
monitor, or calibrator (respectively) are given. n_boot/seed are
shared by every resampling site in the document (metrics.evaluate,
curves.corp_reliability, curves.reliability_smooth), so the whole
document is one call, deterministic given the same inputs and seed
(byte-identical apart from its single Generated ... UTC timestamp line).
format="html" (default) embeds every figure as a base64 PNG, so the file
is fully self-contained: no external requests, no <script>. Emailing it
or dropping it in a model-risk file share needs nothing else.
Every caller-supplied label (group names, grade names, the monitor's
recommendation/alarm_at/onset_label strings, the report title) is
HTML-escaped before interpolation (GFM-cell-escaped for "|" in
format="markdown" tables), so a label containing markup or a table
delimiter renders as literal text, never as injected HTML or a corrupted
table row.
# s_cal, y_cal, ms: held-out calibration scores, outcomes, the masterscale
validation_report(
    y_cal, s_cal, grades=ms,
    format="markdown", path="validation.md",
)
format="markdown" requires path: figures are written as PNG files to
<path stem>_figures/ next to it and referenced with relative GFM image
links, and the tables are GFM tables, the natural format for a PR
description, a wiki page, or a document handed to a generator that does
not render embedded base64 images.
Import cost: import probcal.report never pulls in matplotlib, even when
the [viz] extra is installed; the module imports it lazily, the first
time validation_report actually renders a figure. Calling
validation_report itself still needs [viz], since it renders at least
one figure from y/scores alone; without it the call raises
ImportError naming the extra.