Grouped evaluation
Data these snippets assume
Blocks on this page use a fixed set of names for held-out data instead of re-deriving it each time. To run them, define the names first:
# docs: no-run — the definitions the snippets on this page assume
import numpy as np
from probcal import BetaCalibrator, Masterscale, make_pd_portfolio
from probcal.monitor import CalibrationMonitor

cal_set, new_set = make_pd_portfolio(n=3000, random_state=0), make_pd_portfolio(n=1000, random_state=1)
s_cal, y_cal = cal_set.scores, cal_set.y          # held-out calibration scores and outcomes
w_cal = np.ones_like(y_cal)                       # uniform sample weights
s_new = new_set.scores                            # scores of new obligors
ms = Masterscale.from_edges([0.01, 0.05], names=["G1", "G2", "G3"])   # the masterscale
p_cal = BetaCalibrator().fit(s_cal, y_cal).predict_proba(s_cal)         # calibrated PDs
grades = ms.assign(p_cal)                                              # rating labels
segments = np.array(["seg-a", "seg-b", "seg-c"])[np.arange(len(s_cal)) % 3]  # segment labels
model = ...   # any object with predict_proba(X); the docs use a stub that reads X[:, 0]
mon = CalibrationMonitor(alpha=0.05)              # with a few batches of a calibrated forecast applied
Every block also names, in its first comment line, which of these it uses.
How-to; the bootstrap protocol itself is documented in the Metrics and
tests concepts chapter. This page covers only what by= adds on top of
it.
# s_cal, y_cal: held-out calibration scores and outcomes
import numpy as np
from probcal.metrics import evaluate
from probcal.plots import plot_reliability   # probcal[viz]
from probcal.curves import reliability_binned

segment = np.where(s_cal < 0.01, "retail", "corporate")

report = evaluate(y_cal, s_cal, n_boot=100, seed=42, by=segment)   # 100: fast for the docs harness
report.groups          # sorted labels, e.g. ("corporate", "retail")
report.pooled          # MetricReport on the full data (seed unchanged)
report.reports         # one MetricReport per group, aligned with .groups
report.counts          # observation count per group
report.to_frame()      # long-format rows: group, metric, value, ci_low, ci_high

fig = plot_reliability(reliability_binned(y_cal, s_cal), y=y_cal, p=s_cal, by=segment)
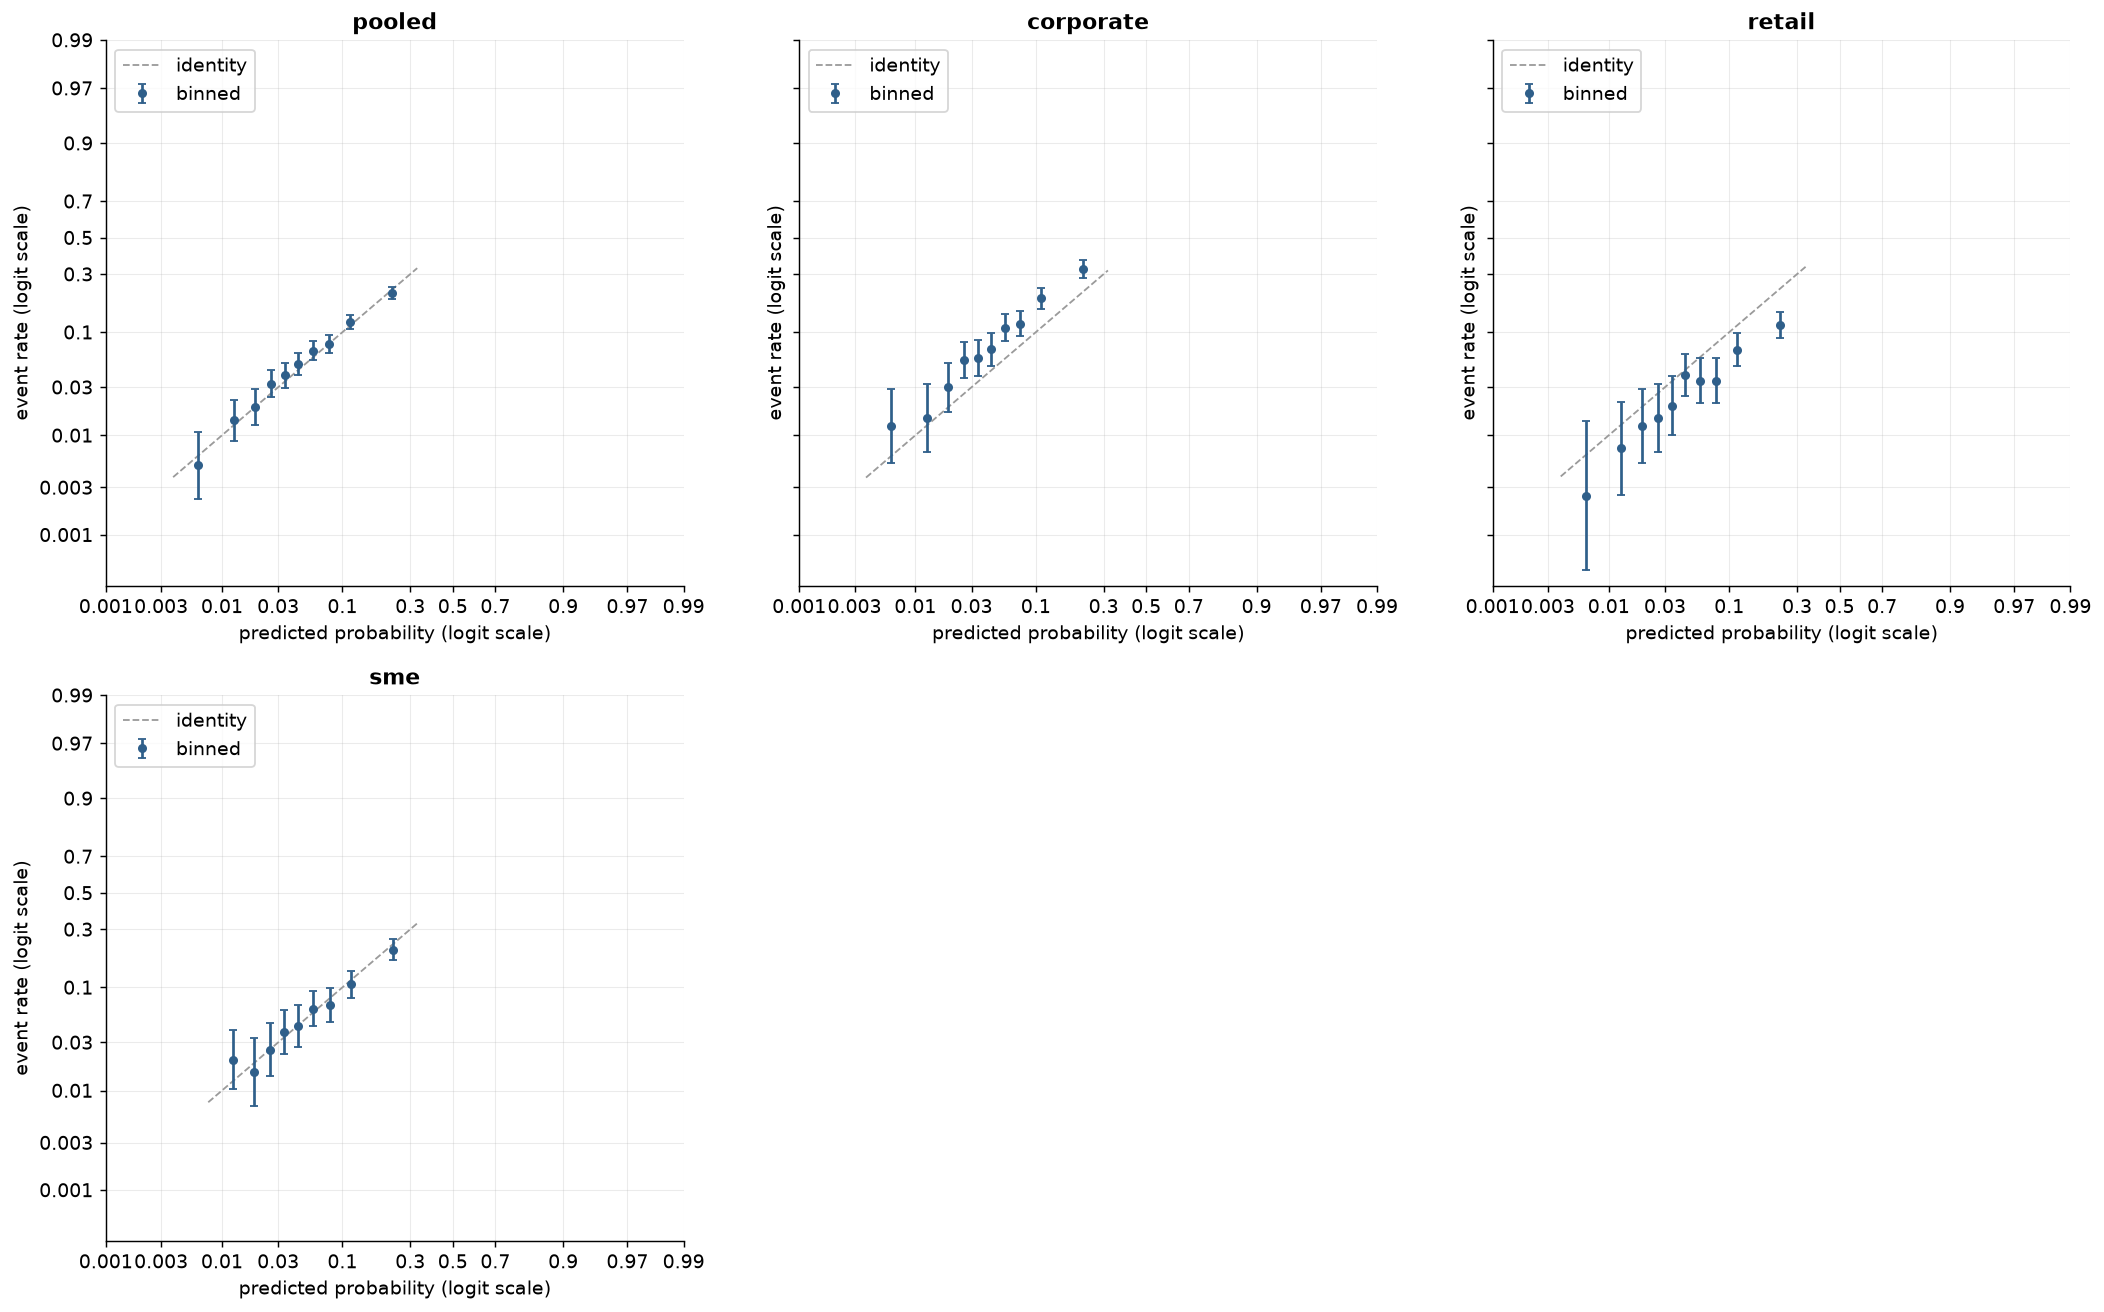
That is the case for looking: the pooled panel is on the identity, and
the three segments are not. Two offsetting level errors cancel in the
pool, so a portfolio that passes every aggregate guardrail can still be
systematically optimistic for one segment and pessimistic for another.
That is what by= is for, and what
Segmented calibration repairs once you have
seen it.
Each group's report is the same call you would make by hand on that
group's slice: evaluate(y[mask], scores[mask], seed=42 + 1000 * i, ...),
where i is the group's position in sorted-label order. Results are
identical whether you group with by= or slice manually, and deterministic
regardless of how many groups exist or what the labels are. A group with
only one outcome class raises the same ValueError a direct call on that
slice would, naming the offending group. plot_reliability(by=...) draws
the same panels: a pooled panel plus one per group, laid out on shared axes
(curve itself is ignored in this mode; each panel rebuilds its own
binned curve from that group's data).
What this is not. by= reports side by side; it runs no test of
whether groups differ, and applies no multiple-comparison correction
across the group reports it returns. Formal group-conditional calibration
testing is future work, not implemented here. Read report.reports
descriptively, the way you would read several evaluate() calls made by
hand.