Getting started
Install
pip install swift-monitoring
Or with uv:
uv pip install swift-monitoring
For development (from source):
git clone https://github.com/wlazlod/swift.git
cd swift
uv pip install -e ".[dev]"
Requires Python >= 3.11 and a trained tree-ensemble model — a LightGBM
Booster or an XGBoost Booster.
First drift test
SWIFT monitors an existing model, so start from a trained booster:
import lightgbm as lgb

# Train a LightGBM model
dtrain = lgb.Dataset(X_train, label=y_train)
params = {"objective": "binary", "verbose": -1, "num_leaves": 31, "n_estimators": 100}
model = lgb.train(params, dtrain, num_boost_round=100)
Then create a monitor, fit it on reference data, and test a monitoring sample:
from swift import SWIFTMonitor

monitor = SWIFTMonitor(
    model=model,
    n_permutations=200,
    alpha=0.05,
    correction="benjamini-hochberg",
)

# Stages 1-3: extract decision points, build buckets, compute SHAP normalization
monitor.fit(X_ref)

# Stages 4-5: Wasserstein distances + permutation test with MTC
result = monitor.test(X_mon)

print(f"Drifted features: {result.drifted_features}")
print(f"Number drifted: {result.num_drifted}")
print(f"Max SWIFT score: {result.swift_max:.4f}")
print(f"Mean SWIFT score: {result.swift_mean:.4f}")
How it works walks through what each stage does.
Read the result
test() returns a SWIFTResult:
| Field | Meaning |
|---|---|
feature_results |
tuple of per-feature FeatureSWIFTResult records |
swift_max |
maximum SWIFT score across features |
swift_mean |
mean SWIFT score across features |
num_drifted |
number of drifted features |
drifted_features |
names of drifted features |
Each FeatureSWIFTResult carries the per-feature detail — feature_name,
swift_score (the Wasserstein distance), p_value from the permutation test,
is_drifted after multiple testing correction, and num_buckets:
for fr in result.feature_results:
    status = "DRIFTED" if fr.is_drifted else "ok"
    print(f"  {fr.feature_name}: score={fr.swift_score:.4f}, "
          f"p={fr.p_value:.4f} [{status}]")
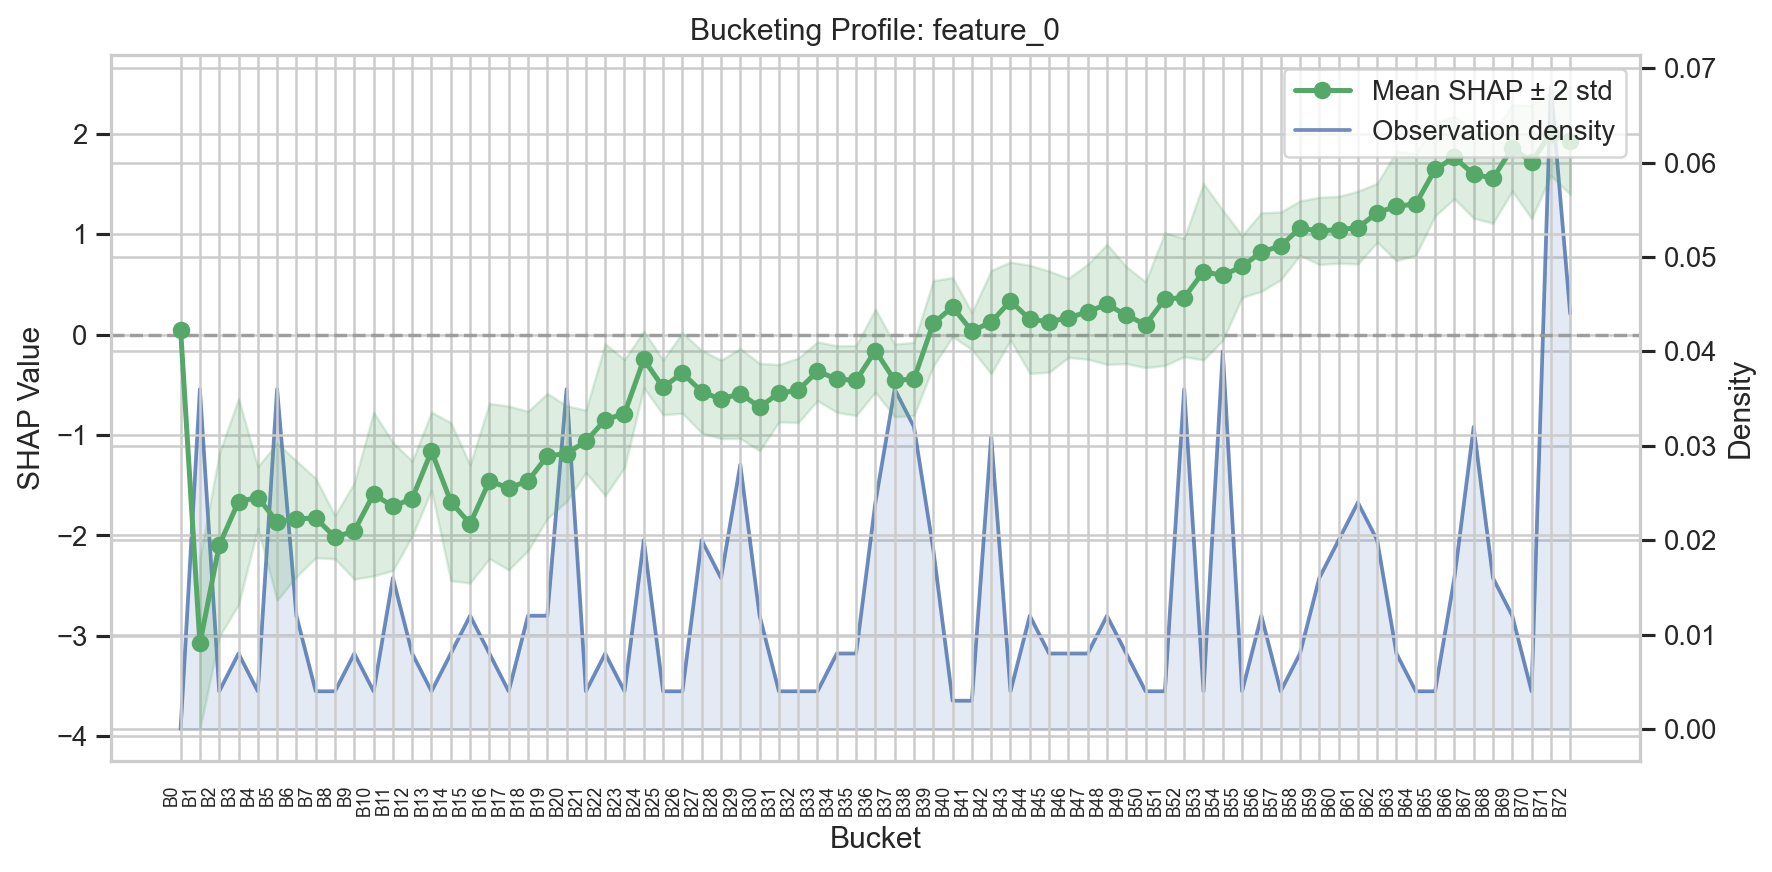
Visualize it
# Bucket profile for a specific feature
fig, ax = monitor.plot_buckets("feature_0")
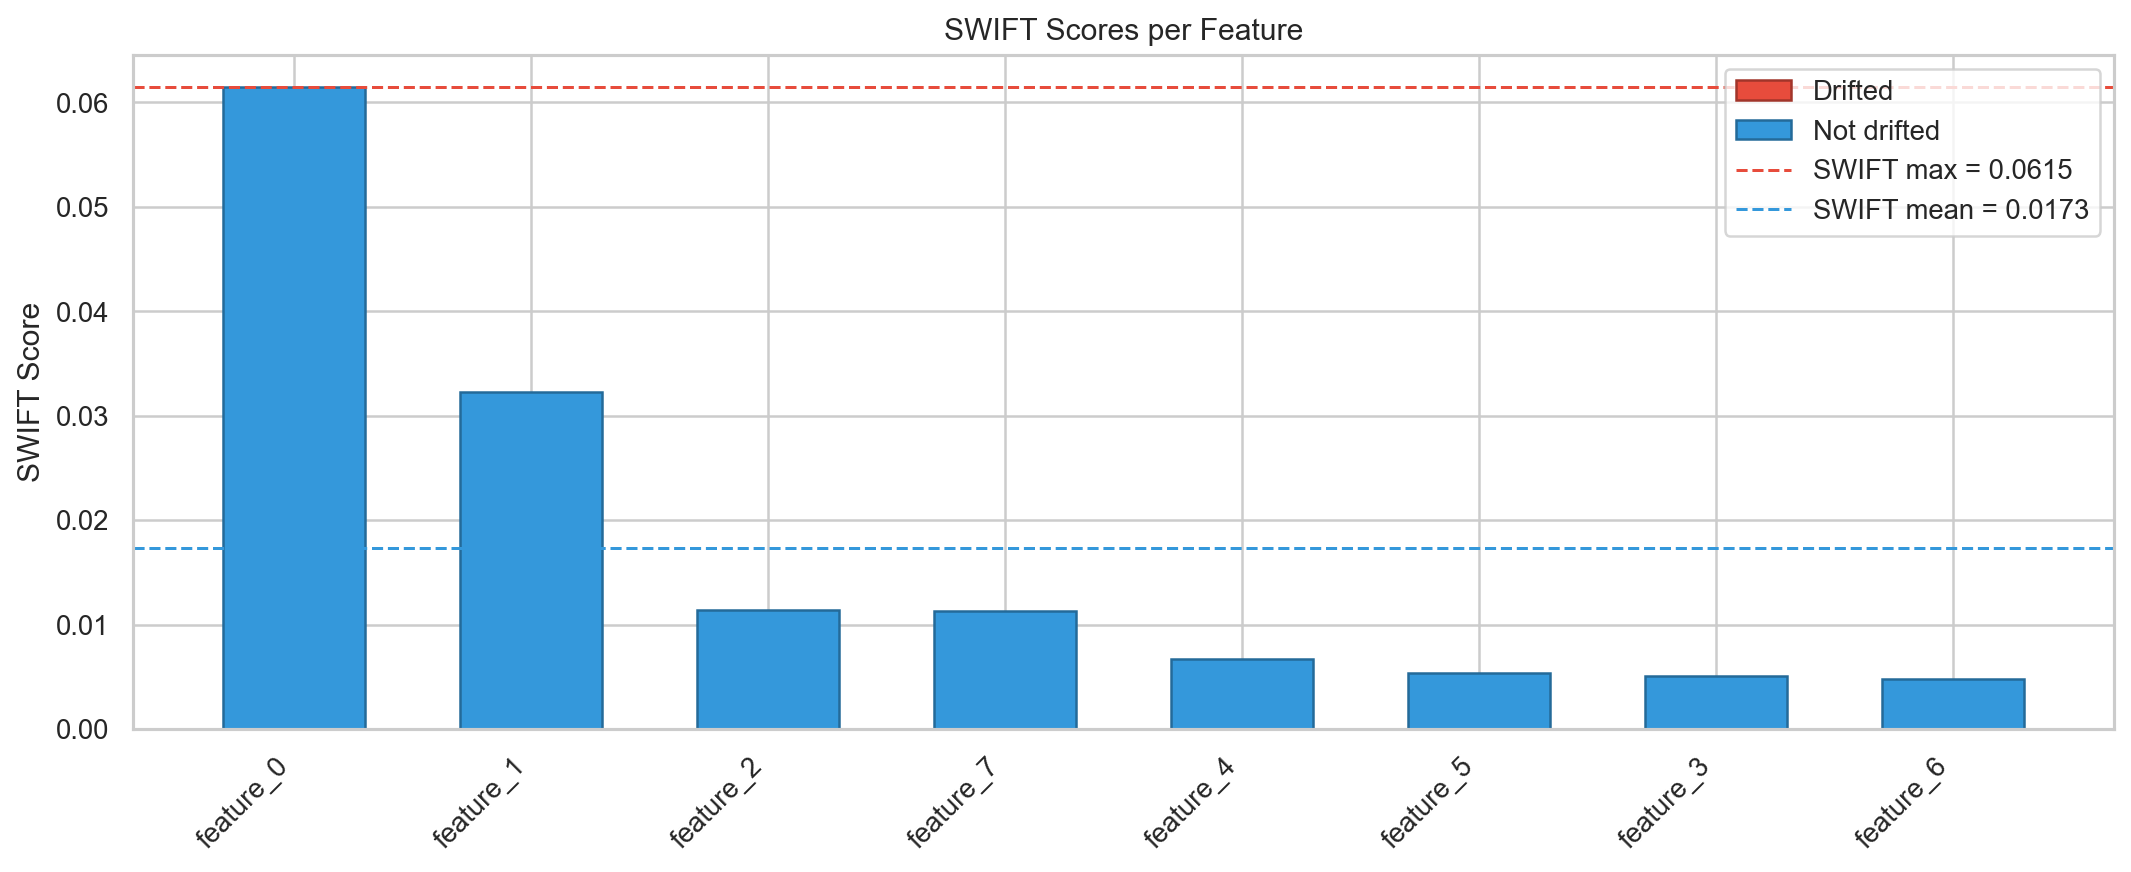
# SWIFT scores overview
fig, ax = monitor.plot_swift_scores(result)
Where next
- How it works — the five-stage pipeline in detail.
- Quickstart tutorial — the same flow as a runnable notebook.
- Concepts — one page per pipeline stage, from models and decision points to aggregation, plus missing values, configuration, scikit-learn integration, and visualization.
- API reference.
- FAQ — common gotchas.